MPEG COMMENTARY - Page 25
June 15, 2003. Not Your Father's Gold Market
Gold Derivatives: Updating the Scorecard. On May 8, 2003, the Bank for International Settlements released its regular semi-annual report on global OTC derivatives, which showed continued robust growth across all major categories during both the last half and all of 2002 (www.bis.org/publ/otc_hy0305.pdf). Total notional value of gold derivatives rose from $279 billion at mid-year to $315 billion by December 31, an increase of $36 billion or almost 13% in the last half alone. On June 2, separate figures for forwards and swaps and for options were reported in table 22A of the BIS Quarterly Review (www.bis.org/press/p030602a.htm).
On June 9, the Office of the Comptroller of the Currency released its report on the derivatives held by U.S. commercial banks as of March 31, 2003 (www.occ.treas.gov/deriv/deriv.htm). Their gold derivatives, held almost entirely by J.P. Morgan Chase, Citibank and HSBC USA, fell marginally from $71.7 billion at the end of 2002 to $67.5 billion at the end of this year's first quarter.
All this new data has been summarized by Mike Bolser in chart form according to his usual practice. When reduced to tonnes, total forwards and swaps now exceed 14,000 tonnes, continuing to push toward the upper reaches of the estimated total short physical position. See Gold Derivatives: Moving towards Checkmate; also Gold: Cover or Cover-up? and Long Con: Mother of Bank Runs.(Note: Because the gold derivatives of investment banks (e.g., Goldman Sachs and Morgan Stanley) and others (e.g., American International Group) are not included in the OCC reports, they do not give a complete picture of all gold derivatives held by major U.S. banks and dealers.)
De-Hedging Throws a Curve. Although estimates vary, total producer hedgebooks apparently declined by some 500 tonnes, from over 3000 tonnes to perhaps under 2500, during calendar 2002. Whatever the exact amount of the decline, it failed not only to manifest itself in total forwards and swaps reported by the BIS, but also to prevent these figures from rising sharply. This phenomenon is wholly inconsistent with the frequently stated view that producer hedgebooks are the principal driver of total gold lending.
With the totals reported by the BIS in a pronounced uptrend, the gently declining trend at the three U.S. commercial banks over the past several quarters suggests that gold derivatives must either be growing strongly at major U.S. investment banks and dealers or elsewise exploding at foreign-based institutions.
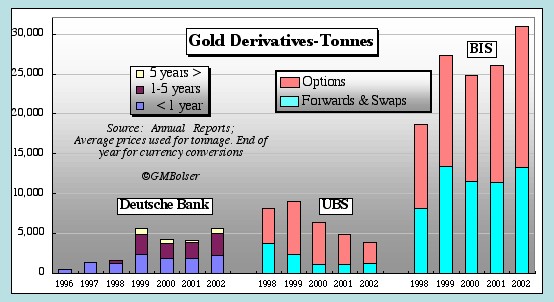
As in prior years, the 2002 annual reports from UBS (www.ubs.com) and Deutsche Bank (www.deutsche-bank.com) include detailed information on their precious metals derivatives (almost all gold). Unlike most other major bullion banks (and most central banks), these two huge international banks do not hide their gold banking operations from any intelligent scrutiny.
Deutsche Bank's OTC precious metals derivatives closed 2002 at E57.5 billion in total notional value, up from E41.6 billion the previous year and eclipsing the old 1999 high of E50.9 billion. The increases over the prior year were spread across all maturities (less than 1 year, 1-5 years, over 5 years) with larger percentage increases coming in the longer maturities (e.g., from E3.6 billion to E6.6 billion in the over 5 years category). Deutsche Bank does not break out forwards and swaps from options.
At UBS, the total notional value of OTC precious metals derivatives declined in 2002 for the fourth year in a row, to CHF56.6 billion from CHF71.1 billion at the end of 2001, and down by just over 50% from CHF112.9 billion at the end of 1999. As in the prior two years, the reductions took place entirely in options. Forwards, which had been reduced from CHF47.7 billion at the end of 1998 to CHF15.3 billion by the end of 2000, closed 2002 at CHF18.0 billion versus CHF17.0 billion the previous year. UBS reports positive and negative market values by maturity but not by notional value.
Converting the figures for Deutsche Bank and UBS to tonnes, Mike has charted them alongside total gold derivatives reported by the BIS. As the chart makes clear, UBS has cut its gold derivatives by half since 1999 while the trend at Deutsche Bank almost exactly mirrors that of the totals reported by the BIS.
The divergences in trend among UBS, Deutsche Bank and the BIS totals are striking. The reductions at UBS may have received a real tail wind from Swiss gold sales. At Deutsche Bank, on the other hand, periodic threats of future gold sales by the Bundesbank can have provided only buffeting. UBS has not been observed to act with the gold price fixing cabal. Deutsche Bank, although missing in action recently, was a charter member. See Complaint, paragraphs 11, 42 and 45. Finally, UBS built its gold banking business over decades. Deutsche Bank built its now larger business in a just a few years beginning at roughly the same time as the gold price fixing scheme.
Newmont Plays Hardball. In a startling recent gambit, Newmont hit back hard at the bullion banks that pitched hedges to Normandy's Yandal subsidiary, which Newmont acquired last year by merger but without becoming directly liable for its obligations. Against proven and probable reserves of just over 2.1 million ounces, Yandal had sold forward (or written options on) some 3.5 million ounces. Having promised to reduce Normandy's hedgebook through "opportunistic" buy-backs, Newmont decided to play hardball in response to an attempt by one of Yandal's bullion banks to exercise right to break clauses in its hedge contracts.
Newmont threatened to let Yandal slide into insolvency unless each of its bullion banks either accepted a cash offer of 50 cents for each dollar of Yandal's net mark-to-market liability on its hedge contracts to that bank as of May 22, 2003, or, alternatively, assigned those contracts to a Newmont subsidiary and entered into new hedge contracts with Newmont equal to an undivided 40% of Yandal's existing hedge obligations to that bank. As of June 3, 2003, all but one of Yandal's bullion banks, collectively representing 94% of the hedged ounces and 76% of the negative mark-to-market liability, had accepted the cash offer for a total payment of $77 million. See Newmont, Press Release, PRNewswire-FirstCall (June 3, 2003).
Whether Newmont will close the deal without an acceptance by the lone holdout, rumored to be Goldman Sachs, before a deadline of June 21 has been questioned (e.g., Tim Wood, "Yandal hedge drama - it's not over yet," Mineweb (June 4, 2003)), but Newmont appears to consider the acceptances in hand as a done deal. See "Newmont says nearly out of Aussie gold hedges," Reuters (June 11, 2003). In any event, two points are clear: Newmont's management is bullish on gold prices; and gold bears are spinning the drama for their own purposes.
Witness a New York bullion trader as quoted by Alden Bentley, "Newmont closes book on Yandal gold hedges," Reuters (June 4, 2003): "It's just a dramatic finish. That hedge book is gone with the exception of that one position. Its going to severely limit the pace of buybacks. It's definitely going to alleviate the upside pressure for gold, once the market digests what happened." Or the following from a newspaper often regarded as close to the Bank of England (John Dizard, "Neither a borrower nor gold lender be," FT.com (June 5, 2003):
In the meantime, the gold lenders to Yandal had to balance their books and offset their newly naked short position by buying up gold over the past few months. That 2.5 million to 3.5 million ounces of gold demand has helped run the price up to its recent peak of around $390. Since the uncollectible loans have been covered, demand and the price have slumped.
Taking the high end of the range, 3.5 million ounces is equivalent to 109 tonnes worth a little over $1 billion at $300/ounce. Newmont announced its offer on May 27, less than three weeks ago. Yandal's bullion banks must have had unusual clairvoyance to cover "over the past few months." What is more, they must have done so with their own money since no cash has yet changed hands. But whether they have already covered or have yet to do so, the key issue is not when but how they cover.
Nothing about Newmont's offer requires or even implies any bullion repayments to those who loaned gold to Yandal's bankers. Unless they elect to cover by purchasing physical metal, the total short physical position of 15,000 tonnes remains unchanged and direct demand in the physical market is not affected. Yandal's bankers are far more likely to cover by purchasing options or other derivatives. In that event, as the recent figures from the BIS demonstrate, 109 tonnes is a drop in the bucket, unlikely to have any noticeable impact on gold prices unless specifically executed for that purpose, and even then having only transitory effect.
Bush League Analysis. At over 30,000 tonnes, total gold derivatives are now approximately equal to total reported official gold reserves. Yet, although the data on gold derivatives reported by the BIS represents the only publicly available information compiled on the global gold market according to a published methodology by a presumably reliable source, neither the World Gold Council nor Gold Fields Minerals Services appears to make any effort to try to reconcile their statistics on global gold flows with the BIS figures.
However, CPM Group, another mainstream provider of data to the precious metals industry, has recently taken a greater interest in the mammoth gold derivatives market. See Tim Wood, "Physical gold trade is a dwarf - CPM Group," Mineweb (June 10, 2003). According to its managing director, Jeffrey Christian: "The physical market has been very small compared to the derivatives trading based on it. Yet, it is surprising the extent to which many gold market observers could not see this very fat, very enormous tail that was wagging the dog."
Contrary to 1999, neither the sharp rally in gold prices in 2002 nor the addition of roughly 5000 tonnes of gold derivatives boosted trading at the London Bullion Market Association, where average daily turnover of gold remained locked in the strong downward trend that began following the spike in turnover precipitated by the Washington Agreement on Gold and consequent rally in prices. See GOLD MARKET REGRESSION CHARTS. Not surprisingly, therefore, reports from the LBMA's recent shindig in Lisbon conveyed a rather gloomy tone. Stewart Bailey reported in "Gold bears hijack LBMA 2003," Mineweb (June 3, 2003):
Of chief concern for the industry's major players is the fact that the much vaunted investment demand, which was to be the silver bullet for the market, has failed to materialize and still languishes around 12 percent of total gold offtake [3978 tonnes in 2002 according to GFMS] each year. The failure of gold as an investment to meet expectations is all the more disappointing given the near perfect conditions for its so-called safe-haven status, or its quality as 'real money' when pitted against the world's fiat currencies; ... .
"There is a feeling of, 'if it doesn't happen now then when's it going happen,'" says Gold Field Mineral Services managing director Phillip Klapwijk.
While gold's 25% price jump in 2002 may have disappointed some gold bulls, it considerably exceeded the published predictions of most if not all analysts in the LBMA fraternity. The alleged shortfall in investment demand is based on nothing more than estimates of dubious and unverifiable validity from GFMS, which put bar hoarding and implied net investment at "a rather anemic" 382 tonnes in 2002, up from 248 tonnes the prior year, according to Stewart Bailey in "Gold still missing the point," Mineweb (June 8, 2003). See also GFMS, "Gold Supply & Demand Report Q1 2003" (May 2003).
In contrast, CPM Group reported in its "Gold Survey Press Release" (April 29, 2003):
The sharp rise in gold prices in 2002 reflected a massive rush into gold by investors worldwide. Investors bought more gold bullion in 2002 than they had in any year since 1967, the year that investors flooded the world’s central banks with their paper money in exchange for gold, leading to the collapse of the post-war gold-dollar standard for international currency markets. ...
The dynamics of the market are that investors, stimulated by international financial, economic, and political conditions, raced to buy gold last year, purchasing an estimated 26.9 million ounces [836.7 tonnes] on a global net basis. This investor buying, more than double the 10.0 million ounces [311 tonnes] purchased by investors on a net basis the year before, in 2001, squeezed jewelers and other fabricators out of the gold market, and led other people to sell their jewelry and other gold-bearing items to scrap dealers for its gold content.
These widely varying figures on investment demand apparently reflect different approaches to measurement. GFMS looks exclusively at physical demand. CPM Group also takes into account paper gold, including derivatives. Last year alone, gold derivatives accounted for twice as much tonnage as gold producers and equaled 125% of GFMS's estimate of total physical offtake. Under these circumstances, gold's performance is rather creditable. What is more, it should be quite alarming to the central banks whose vaults are slowly and steadily being emptied even while significant investment demand is being diverted into paper gold.
Big League Analysis. "Gold: The Investment Case, the Commodity Case" (March 21, 2003), Frank Veneroso's most recent published article on the gold market, is mandatory reading for all gold bugs and anyone else who follows gold. (Available at the same URL is an MP3 audio file of Mr. Veneroso's June 6, 2003, conference call on "Gold Bullion Flows and the Outlook for Gold.")
Most of the article is devoted to an analysis of multiple factors that are expected ultimately to result in an upsuge of investment demand for gold. In this connection, some "very rough numbers on the composition of the global balance sheet" are cited (at page 12) to show that total global gold holdings, including official reserves, amount to just $1.4 trillion, as against total global private monetary and financial assets of over $100 trillion, of which privately held bullion accounts for a mere $300 billion, leading to the conclusion (at pages 25-26): "[G]iven the small role that gold now plays in so large a global wealth portfolio, only a miniscule asset allocation toward gold could blow the lid off the gold price."
For present purposes, the key point is found on page 5:
On the internet there is still much discussion of the gold loan position [i.e., total short physical position of 10,000 to 15,000 tonnes]. Many gold bulls are eagerly awaiting the inevitable short covering explosion in gold. Well, it's time has passed. What we have instead is simply a gold market under management by an official sector that has far less ammunition to enforce its management than most people realize. For this reason we believe that the official sector will lose control within perhaps three to five years. If investment demand materializes in the global gold market, that day will come earlier. ...
The new data on gold derivatives is consistent with this view. The anticipated gold short covering rally has largely occurred, most notably after the Washington Agreement in 1999 and again in the latter part of last year. It was turned back in 1999-2000 and blunted in 2002 by massive explosions in gold derivatives. In other words, investment demand was satisfied by paper gold whenever possible rather than physical bullion, and derivatives were employed whenever necessary to transfer risk from the bullion banks to the central banks.
Some simple examples may help to illustrate these processes. When investors go long in gold through futures, options or even gold certificates, they are accepting someone's promise to pay gold in place of physical bullion. What is more, if the long position is closed out at a profit which the investor is willing to take in cash rather than metal, no physical gold need ever be involved. While the prudent seller (or writer) of the long position normally delta hedges its exposure, that hedge too could -- and frequently is -- carried out in the paper market. Given the very small size of the gold market relative to other investment and financial markets, losses that bullion banks can settle in cash rather than metal are unlikely to threaten any widespread systemic failure because they can easily be handled by the central banks.
To take another example, suppose a producer de-hedges by delivering into a forward contract. The bullion bank receives the metal, but is it then returned to the central bank lender? Not necessarily. If metal is required to meet demand in the physical market, the central bank may elect to roll over its gold loan to the bullion bank while simultaneously selling it a new hedge to replace the producer's contract. In this event, the original gold loan stays on the books of both banks. In the bullion bank's derivatives reporting, the forward contract with the producer is simply replaced by one with the central bank or an equivalent option. Indeed, if done at a higher effective price for the same weight of gold, the notional value of the new hedge will be greater than that of the one it replaces.
Father Knows Best. One of the more promising recent developments in the gold market is the creation of exchange traded funds and similar vehicles that try to make it easier for investors to acquire and hold what is effectively allocated gold, and thereby to support and augment physical demand. The premature demise of the short covering rally has postponed but not canceled the next roaring bull market for gold. It will break out when physical investment demand exhausts or overwhelms the willingness of the central banks to continue to empty their vaults, or when some other event reveals the extent to which their physical gold reserves have already been depleted.
In earlier times, when the volume of paper gold grew too large relative to physical supply, bank runs, panics, devaluations or "going off specie" followed. The last big event of this nature was the closing of the U.S. gold window in 1971, more than a generation ago. Since then, the modern mind has become accustomed to thinking of financial wealth in dollars having no fixed relationship to gold (or any other real asset). Under these conditions, abetted by modern derivatives, the supply of paper gold has mushroomed relative to physical supply.
Famous investor Warren Buffett has suggested that derivatives are a form of financial sewage. His father took a similar view of irredeemable paper money. Concluding a 1948 speech to the Conference of American Small Business Organizations, "Human Freedom Rests on Gold Redeemable Money" (The Commercial and Financial Chronicle (May 6, 1948), Nebraska Congressman Howard Buffett stated:
The paper money disease has been a pleasant habit thus far and will not be dropped voluntarily any more than a dope user will without a struggle give up narcotics. But in each case the end of the road is not a desirable prospect.
I can find no evidence to support a hope that our fiat paper money venture will fare better ultimately than such experiments in other lands. Because of our economic strength the paper money disease here may take many years to run its course.
But we can be approaching the critical stage. When that day arrives, our political rulers will probably find that a foreign war and ruthless regimentation is the cunning alternative to domestic strife. That was the way out for the paper-money economy of Hitler and others.
In these remarks I have only touched the high points of this problem. I hope that I have given you enough information to challenge you to make a serious study of it.
I warn you that politicians of both parties will oppose the restoration of gold, although they may outwardly seemingly favor it. Also those elements here and abroad who are getting rich from the continued American inflation will oppose a return to sound money. You must be prepared to meet their opposition intelligently and vigorously. They have had 15 years of unbroken victory.
But unless you are willing to surrender your children and your country to galloping inflation, war and slavery, then this cause demands your support. For if human liberty is to survive in America, we must win the battle to restore honest money.
There is no more important challenge facing us than this issue -- the restoration of your freedom to secure gold in exchange for the fruits of your labors.
Since 1948, the proponents of paper money have remained ascendant for more than half a century. Nevertheless, Americans have regained "the freedom to secure gold" in the open market. The question posed by the Buffetts -- father and son -- boils down to this: Can crap be saved with more crap? As strange as today's gold market would seem to their fathers, for today's investors the reasons to hold gold are the same as ever.
We think our fathers fools, so wise we grow;
Our wiser sons, no doubt, will think us so.
Alexander Pope (An Essay on Criticism, 1711)
May 11, 2003. Long Con: Mother of Bank Runs
Confidence games take many forms. Generically, they are swindling operations in which the perpetrator profits himself by taking advantage of the confidence reposed in him by the target to create some sort of false illusion that causes the victim to act against his own interest. In the most elaborate and successful confidence games, or "long cons" as they are sometimes called, the "con artist" often presents his illusion so convincingly that the mark refuses to believe that he has been fooled despite the later revelation of overwhelming evidence to the contrary.
By its very nature, fractional reserve banking -- particularly as developed under the gold standard -- amounted to little more than a con game. At the same time that they loaned out a substantial percentage of total customer gold at maturities considerably longer than sight, bankers had to assure individual depositors that their own gold remained available on demand. Loss of confidence led to bank runs that caused bank failures when sufficient gold could not be mustered on short notice.
More recently, gold banking has produced a new con game: the dishoarding of physical gold by central banks through leasing and swaps while at the same time keeping it on their books as if still in their vaults. Their principal marks were gold mining companies, many of which were tricked into large forward sales of future production by declining gold prices primarily caused by these unseen and unreported physical supplies hitting the spot market.
New Evidence from James Turk. A fascinating recent report by James Turk contains some startling revelations about the manner in which this con was initiated. See James Turk, "More Proof," Freemarket Gold & Money Report (Letter No. 323, April 21, 2003). Inspired by a study sponsored by the International Monetary Fund ten years ago (Gary O'Callaghan, The Structure and Operation of the World Gold Market (IMF, Occasional Paper 105, 1993), esp. table 7 ("Financial Gold Flows Through the United Kingdom, 1960-90") at p. 21), James set about trying to update the statistics on U.K. gold exports and imports for the 1991-2002 period.
The U.K. does not follow the IMF's recommended distinction between "monetary" and "nonmonetary" gold, but instead distinguishes between "commodity" gold (i.e., "gold moving into or out of finished manufactured form [except bullion coins]"), which is included in merchandise trade figures, and "monetary" or "financial" gold, which includes movements in or out of official reserves, including gold held on deposit or under earmark by the Bank of England for foreign central banks, as well as physical flows resulting from interbank dealings or transactions on the London Bullion Market. Ibid., pp. 33-35 (appendix).
As James notes: "The Bank of England is very secretive about its gold activity and does not disclose the quantity of gold held in its vaults for the custody of others, mainly central banks." In the United States, any net gold flows out of foreign earmarked accounts at the Federal Reserve Bank of New York are reported by the Fed as well as included in exports of nonmonetary gold by the Commerce Department. See The Fed: Up to its Earmarks in Gold Price Manipulation? (5/15/2000); Central Banks vs. Gold: Winning Battles but Losing the War? (June 11, 2000); Plaintiff's Second Affidavit (at paragraphs 2-5); Complaint (at paragraph 40).
Unlike the United States, however, the United Kingdom does not have a significant gold mining industry contributing new mine production to its total gold exports. Accordingly, net flows of U.K. financial gold necessarily consist primarily of official or semi-official gold, arising from sales or purchases or in connection with leases, loans, swaps or deposits. Also included would be any private transactions in gold bullion on capital account. However, neither the bullion banks individually nor the LBMA are thought to hold large physical reserves for their own account. Accordingly, although they may implement large physical flows of imports and exports on capital account, they are unlikely themselves to be the source of any large net dishoarding.
As he recounts in his report, James succeeded in updating the figures in the previous IMF study to bring them through the first nine months of 2002. His report includes a table that tallies the net U.K. financial gold flows for the 1991-2002 period along with the reductions in foreign official gold held under earmark at the N.Y. Fed over the same period. It shows a net total cumulative dishoarding of financial gold from the United States and the United Kingdom over that period of almost 7300 tonnes. Working from this figure and making estimates for other major centers engaged in the transfer of physical gold, James arrives at an estimated total short physical position of around 15,000 tonnes, essentially the same figure as discussed in Gold Derivatives: Moving towards Checkmate.
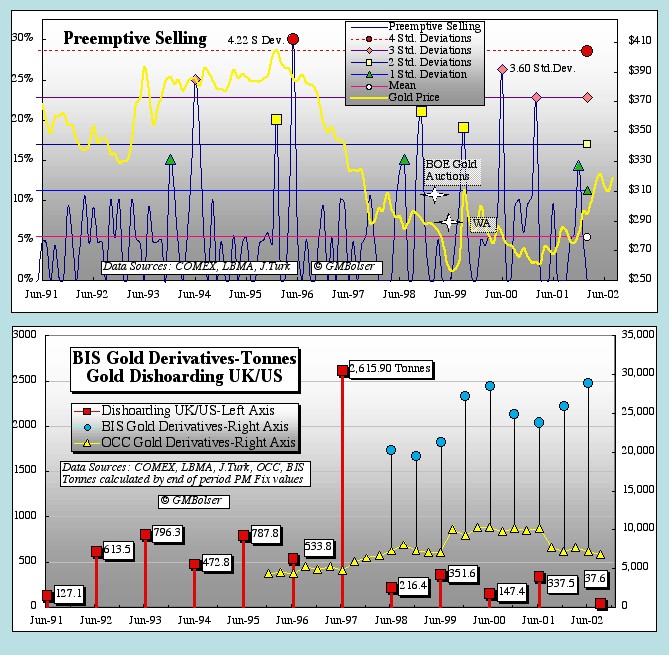
Setting the Hook. James's report contains one figure that is just stunning. In 1997 net exports of financial gold from the United Kingdom amounted to 2,472.9 tonnes, or an amount roughly equal to that year's total new mine supply. Combined with an additional 143 tonnes from the foreign earmarked accounts at the New York Fed, total U.K./U.S. dishoarding of financial gold in 1997 amounted to 2,615.9 tonnes, well over three times as much as in the next highest year (787.8 tonnes in 1995) and almost doubling the cumulative total (3,580.6 tonnes) as at the end of 1996.
Mike Bolser, resident chartist at The Golden Sextant, has described "preemptive selling" of gold on the COMEX in three previous articles: Preemptive Selling of Gold: The Bigger Picture (10/23/2002); Mike Bolser Updates His Study of Gold Manipulation on the COMEX (6/18/2001); Evidence of Gold Manipulation on the COMEX (12/6/2000). The Complaint (at paragraphs 46-55, 60) in the Gold Price Fixing Case relied importantly on Mike's first article, which was posted at this site one day before the case was filed.
At my request, Mike has prepared the following two charts, which combine on the same time scale from June 1991 through June 2002: (1) gold prices; (2) preemptive selling; (3) James's new data on net dishoarding of gold from the United Kingdom and the foreign earmarked gold accounts at the N.Y. Fed; and (4) previously discussed data on gold derivatives from the Bank for International Settlements and Office of the Comptroller of the Currency.
The IMF study followed by James also contained a table covering financial gold flows through Switzerland. See table 8 ("Gold Flows Through Switzerland, 1968-91"), p. 22. Whether this table can be similarly updated is under investigation. However, lending of physical gold by the Basel-based BIS provides an instructive window on limited but important gold flows from Switzerland.
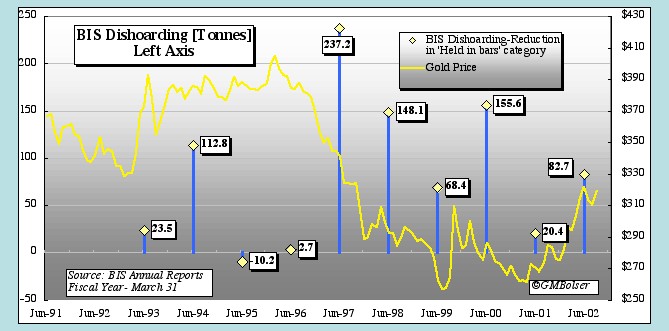
The BIS operates in part as a bullion bank for central banks, accepting gold deposits and using a portion of them to make gold loans. As noted in Gold Derivatives: Moving towards Checkmate, the picture at the BIS in recent years is best described as "less gold working harder" (gold deposits declining with gold loans rising), all as portrayed graphically by Mike in an earlier chart. In the chart below, Mike has reworked that data to show in tonnes the annual changes in physical gold (i.e., gold "held in bars") by the BIS.
Physical dishoarding from central bank accounts at the BIS peaked in 1997 (fiscal year ending March 31, 1998) at an amount that was almost twice the previous four years combined and more than 50% higher than in any subsequent year. Adding the 237.2 tons from the BIS to the record U.K./.U.S. dishoarding of 2615.9 tonnes gives a total of more than 2850 tonnes of official (or officially procured) gold hitting the physical market circa 1997.
Gold prices fell in 1996 from over $400/oz. early in the year to around $380 by mid-November and closed the year just under $370. From this level, prices fell steadily throughout 1997 to end the year at around $290, a decline of more than 20%. As noted in the Complaint (paragraphs 50-51), this period of falling prices was initiated by two heavy waves of preemptive selling in 1996, the second exceeding four standard deviations. (The first wave occurred in mid-1994 coincident with the Fed's decision to assume the two seats on the BIS's board originally allocated to it in 1930 but never previously filled.)
Since central banks frequently employ forward sales in connection with implementing large official sales, a portion of the 2850 tonnes dishoarded in 1997 almost certainly related to forward contracts entered into in 1996, some of them no doubt in connection with the two instances of heavy preemptive selling identified by Mike. James asks rhetorically: "Why would this weight of gold ... be mobilized unless to intervene in the gold market with result of suppressing its price?" Although the question largely answers itself, some elaboration is in order.
Discussing gold in its 67th Annual Report (June 8, 1997, for fiscal year ending March 31, 1997), the BIS observed (at p. 95):
The London Bullion Market Association recently reported that clearing turnover in gold in London in late 1996 was equivalent to about $11 billion per day. According to a Bank of England survey, most of the trading was spot -- both physical and book-entry -- with a significant forward market and an active option market. ...
This high trading volume reflects the increased propensity of gold producers to lock in their output prices by selling their gold forward. The lack of an upward trend in prices may spur such selling, but so does the less speculative desire by producers to reduce the volatility of their cash flows in order to improve their access to credit.
What will "spur" forward sales by producers far more effectively than flat prices are steadily falling prices, especially as they begin to approach total costs of production. What is more, in these circumstances the producers' banks will have far more leverage with respect to requiring forward sales as a condition of lending.
Gold prices remained generally in the $370-390 range from 1993 through 1996 notwithstanding U.K./U.S. dishoarding averaging in excess of 640 tonnes per year. To set them on a convincing downward path required not one but two incidents of preemptive selling in 1996 followed by the extraordinary dishoarding of 2850 tonnes in 1997.
At its peak, total producer hedging probably never exceeded 3500 tonnes. Excluding net official sales in 1997 of just over 400 tonnes (see below), some 2450 tonnes that year must have entered the market through borrowing or swaps. Since even at its peak forward selling by producers is unlikely to have reached more that 500 tonnes in any single year, roughly 2000 tonnes must have entered the physical market largely through the gold carry trade in 1997 alone.
By hiding the true source of the price pressure and attributing the decline in gold prices in 1997 to a range of structural factors -- official sales, producer hedging, declining inflation rates -- likely to continue into future years, the central banks were able to create the illusion of weakening prices as far as the eye could see. This false picture gave producers added incentive to hedge, setting the hook for a con in which producer hedging shouldered a greatly exaggerated share of the blame for weak gold prices while simultaneously providing cover for large scale official dishoarding through the gold carry trade.
Working the Sting. As James notes and Mike's charts underscore, the con could not be effected with paper gold alone. Physical gold was required to fill a widening gap between physical demand and new mine supply plus scrap.
The Bank of England apparently all but exhausted its customers' gold in 1997. For the next four years, as James's table shows, annual dishoarding from the N.Y. Fed ran at a rate just over 300 tonnes, but in 2002 dropped to a mere 32 tonnes. In May 1999, after a proposal to sell gold held by the International Monetary Fund ran into opposition in the U.S. Congress, the United Kingdom announced a series of 17 bimonthly auctions running until March 2002 under which the Bank of England sold a total of approximately 400 tonnes from official reserves.
As the amount of physical gold available for dishoarding began to run short, the con required increasing reliance on gold derivatives. Announcement of the British auctions, made just as gold prices threatened to push back over $300, was backed by a fourth wave of heavy preemptive selling. The rally in gold prices following announcement of the Washington Agreement on Gold at the end of September 1999 was similarly met by yet another round of heavy preemptive selling as well as a huge spike in gold derivatives.
Last year, U.K./U.S. physical dishoarding dwindled to less than 40 tonnes and the BIS could mobilize barely more than 80 tonnes. At the same time, due in large measure to pressure from shareholders who were becoming increasingly aware of the con, producers began quite actively to reduce their hedgebooks. Still, total gold derivatives continued to rise. See Gold Derivatives: Moving towards Checkmate.
New data just released by the BIS on May 8, 2003, for global OTC derivatives as of year-end 2002 (http://www.bis.org/publ/otc_hy0305.pdf) shows that the total notional value of gold derivatives rose from $279 billion at mid-year to $315 billion by December 31, an increase of $36 billion or almost 13% in the last half alone. Yet derivatives were still insufficient to hold the sub-$300 line without heavier physical backing. Gold prices, which had closed 2001 and 2000 near $275 and the three previous years running at around $290, ended 2002 at $347 in New York, a gain of more than 25% over the prior year.
This year, pressure in the physical market appears even stronger. Unexpected sales by Portugal, attributed by some to deliveries required under maturing call options written in earlier years, have now theoretically limited official sales under the WAG until the end of September to Switzerland's scheduled six tonnes per week. See James Sinclair, "Gold Sales Coming to End," Jim Sinclair's MineSet (May 7, 2003); Michael J. Kosares, "Washington Agreement Suddenly Gets Messy," MK's Gold Commentary & Review (April 28, 2003). On the demand side, new exchange-traded instruments are being created to facilitate investments in physical bullion. See Tom Locke, "Gold-Backed Shares Considered for U.S., South Africa," Dow Jones Business News (April 16, 2003).
Fooling the Mark. Until James's report, the extraordinary and wholly unprecedented amount of official dishoarding that took place in 1997 has never been publicly disclosed. In explaining the 1997 decline in gold prices, the BIS put out the message that its central bank members wanted people to hear (68th Annual Report (June 8, 1998), p. 112): "The price of gold responded to Asian developments and declining world inflation. Observers also cited official gold sales, Germany's decision to lease official gold and a proposal to sell Swiss gold reserves in explaining gold's weakness" [emphasis supplied].
The most effective way to fool the gold mining industry is to fool (or co-opt) the World Gold Council (www.gold.org), the primary producer association, and Gold Fields Minerals Services (www.gfms.co.uk), the principal provider of statistical and other information on the industry.
The WGC, speaking for itself and GFMS in 1998, reported: "In its annual survey 'Gold 1998', published in May, GFMS puts last year's net sales of official gold at 406 tonnes, the result of gross sales of 844 tonnes and gross purchases of 438 tonnes." WGC, Gold in the Official Sector (Number 4, July 1998), p. 3. "In the past two years alone, GFMS estimates that the official sector has mobilized an additional 1,000 tonnes, two-thirds of it in 1997, bringing the total of central bank gold in the market on swap or deposit at end-1997 to an amount probably exceeding 3,700 tonnes." WGC, Gold in the Official Sector (Number 3, April 1998), p. 3.
All the gross sales (844 tonnes) plus two-thirds of additional gold placed on swap or deposit in 1996-1997 (667 tonnes) amount to just over 1500 tonnes in 1997. All this gold did not come out of the United Kingdom, but even if it had, the London-based GFMS would have missed a thousand tonnes dishoarded right under its nose. In any event, if the figures on flows of financial gold out of the United Kingdom in 1997 are correct, GFMS and the WGC failed to uncover -- or at least to report -- a massive amount of official dishoarding that took place that year and was the principal factor in driving gold prices from near $400 to below $300.
In the manner of many marks of classic long cons, neither the WGC nor GFMS is likely ever to admit that they were fooled, or that the total short physical position ever exceeded 5000 tonnes. Professional reputations are at stake. The truth threatens only to set many of their officials free to find new work, and their members or clients free to find more effective representation or more reliable sources of information.
The WGC resisted all offers of assistance from Frank Veneroso when he suggested that its figures were significantly understating physical demand. See Frank Veneroso, The 1998 Gold Book Annual (Jefferson Financial, 1998), esp. pp. 37-62. Similarly, when publicly reported figures on gold derivatives supported Frank's views and suggested that official gold lending greatly exceeded prior estimates, the WGC responded with a study making the discredited argument addressed in a prior commentary that notional values for derivatives represent turnover rather than position data. Both the WGC and GFMS have refused to accept offers by GATA as well as independent third parties to hold a debate on the size of the short physical position between teams representing the GATA position of 10,000-15,000 tonnes and the WGC/GFMS position of 5000 tonnes.
In "Lamers on leasing," Gold in the Official Sector (Number 20, July 2002), the WGC reported on a talk given at the LBMA's 2002 annual conference by Jan Lamers, head of bullion operations for the Dutch central bank. As of June 2002, Mr. Lamers claimed that the Dutch central bank had "approximately 140 tonnes of gold on deposit," or almost 17% of its claimed 840 tonnes of gold reserves. In "Driven by borrowers," a companion article in the same issue, the WGC comments: "Using the latest figures of official sector holdings of gold reserves (owned by countries but excluding multilateral institutions), it would seem that the proportion lent to the market averages around 15-16%."
Excluding multilateral institutions, official gold reserves are just under 30,000 tonnes, so that 15-16% would yield total lending of approximately 4500 to 4800 tonnes. However, by speaking only of gold "on deposit," Mr. Lamers appears to have excluded gold out on swap, not to mention gold that might be subject to call under written options. Curiously, although its report on gold mobilized by the official sector in 1997 referred to gold "on swap or deposit," the WGC failed to make this distinction in 2002 despite all the evidence that had surfaced by that time suggesting that official sector lending greatly exceeded 5000 tonnes.
Mother of Bank Runs. Ponzi schemes and other long cons that try to take advantage of not just one or a few marks but a much broader public always hit the wall described in a famous but unauthenticated quote regularly attributed to Abraham Lincoln: "You can fool all the people some of the time and some of the people all the time, but you cannot fool all the people all the time."
When a long con unravels in the world of gold banking, it is well to remember that there's no run like a bank run, and no rush like a gold rush. Then the key to financial survival is found in two bits of common sporting advice: Go for the gold. He who hesitates is lost.
In the era of free banking under the gold standard, bank panics were typically rather local events unless they occurred in important financial centers. With the advent of central banking, major bank panics took on more national importance, and in the most severe instances could lead to devaluation, going off gold, or other extreme measures, e.g., gold confiscation as happened in the United States in 1933.
All these problems were supposed to have passed into history with the breakdown of the Bretton Woods system and the effective removal of gold from the international and nearly all national monetary systems. See Second Amendment to the IMF's Articles of Agreement (effective April 1, 1978), which prohibits members from linking their currencies to gold and commits the IMF and its members to "the objective of avoiding the management of the price, or the establishment of a fixed price, in the gold market."
The recent con pulled by the central banks to suppress gold prices did not merely violate this provision. Rather, it demonstrated that the provision itself was unrealistic, and that whatever governments may say or order, gold remains in fact what it has always been: permanent, natural money and the standard against which all paper money must eventually be judged. Indeed, by suppressing gold prices, the central banks (and certain finance ministries) were trying to perpetrate and maintain a far grander illusion: that today's dollar-based reserve currency international monetary system with floating exchange rates remains sound; that they can successfully manage any major financial crises that occur; and that they have both the tools and the ability to guide the world economy to satisfactory levels of growth and prosperity.
These assertions have long been questioned in numerous commentaries at this site. See, e.g., The Greatest Con: The Rubin Dollar (February 8, 2000). What is much more important is that they are now being more widely questioned, as several interesting articles from the past few days illustrate. See, e.g., John Dobosz, "Guru's Still Going For Gold," Forbes.com (May 7, 2003); Marshall Auerback, "Is Dollar Weakness Signalling Problems Ahead," PrudentBear.com (May 6, 2003); Bill Fleckenstein, "The dollar is on borrowed time," MSN.money (May 5, 2003). Two of these articles pointedly discuss how individual investors can use gold to protect themselves from an imploding dollar.
In many ways a more interesting question is how foreign central banks -- stuffed to the gills with dollar-denominated paper -- can accomplish the same objective. And the answer is the same: with gold, their traditional reserve asset. When the central banks realize that too many are not just wise to their scam but also are taking advantage of it, that the gold con artists themselves have become the marks, the greatest bank run in history will shift into high gear. It will be a run not just from dollars, or even from paper currency in general, but from modern central banking itself as the lenders of last resort succumb to the resurrected worldwide preference for the financial asset of last resort.