MPEG COMMENTARY - Page 12
June 11, 2000. Central Banks vs. Gold: Winning Battles but Losing the War?
Many in the gold community, including myself, have assumed that the European Central Bank and the Bank for International Settlements are operating with a definite strategy for restoring gold to the center of the international monetary system, and in the process making the euro the preferred currency for international transactions. But evidence is now accumulating to shed doubt on this assumption, or at least to suggest that whatever their strategy, it is rapidly being overtaken by events and by their own short gold positions or those of the bullion banks for which they are responsible.
Suspicious Gold Activities of Deutsche Bank. Disclosure of Deutsche Bank's huge gold derivatives position, much of it obviously built up in the wake of the Washington Agreement, was the first major public indication that the central banks of the Euro Area may not be as together on gold as advertised. Perhaps the most benign explanation of Deutsche Bank's gold derivatives, as well as Dresdner Bank's which are similar in pattern but smaller in absolute scale, is that reaction in the gold market to the Washington Agreement revealed a short position far larger than the signatory European central banks anticipated. Facing a melt-up in gold prices and possible defaults on their own outstanding gold loans, these banks -- probably further prodded by Anglo-American pressure -- permitted the two German banks to participate in a rescue operation alongside Morgan Guaranty Trust and Citibank.
Of course, this hypothesis does not explain how Deutsche Bank apparently learned of the British gold sales a day ahead of the announcement, and perhaps not coincidentally at the very time that its acquisition of Banker's Trust was being finalized. As The Economist recently reported (May 27, 2000, p. 81): "Deutsche Bank is still striving for a place in investment banking's 'bulge bracket' of big American firms." There is nothing in the modus operandi of the Clinton administration to suggest that it would have been averse to using the German bank's ambitions and its desire for Banker's Trust as a lever to recruit it into the gold cabal.
But if Deutsche Bank became a quisling to the euro in May 1999, that does not necessarily mean that it could not have rejoined the euro camp in September. In that case, pitching in to help contain the unexpected strength of the gold market's response to the Washington Agreement, it might still have remained visibly on the short side although working for a different master. Still, according to recent reports from GATA's sources, Deutsche Bank remains one of the prominent sellers on the COMEX whenever gold approaches important technical levels.
Continued Rapid Growth of Gold Derivatives. On June 6, the OCC released its report on the off-balance-sheet derivatives of the U.S. commercial banks as of March 31, 2000. The total notional amount of gold derivatives increased from $87.6 billion at year end to $95.5 billion at March 31. Morgan's decreased slightly from $38 billion to $36.3 billion, but Chase's increased by over 40% from $22 billion to $31.5 billion. With respect to maturities, Morgan reduced the notional amounts of its longer maturities (over one year) by $5.3 billion but added $3.6 billion to its shorter (under one year) maturities. However, Chase more than made up for the decline in Morgan's longer maturities, so that at the end of the period the total notional amount for under one year maturities increased by $6.2 billion from year end, and for one to five year maturities the total increase was $1.7 billion. Over five year maturities remained essentially unchanged, as did the amounts of Citibank's gold derivatives and the amounts for all others.
Converted at $300/oz., the total increase of $7.9 billion amounts to about 820 tonnes, and Chase's increase of over $9.4 billion to 980 tonnes. Chase has the reputation of doing a lot of its gold derivatives business with gold mining companies. Accordingly, the increases of $4.9 billion (510 tonnes at $300/oz.) in its one to five year maturities and $2.3 billion (240 tonnes) in its over five year maturities suggests considerable producer covering of forward contracts given the industry's aversion to forward selling precipitated by the Ashanti and Cambior fiascos. Perhaps more companies are negotiating the same sort of deal on purchased calls as Barrick. See The New Dimension: Running for Cover.
On the other hand, some of the increases may represent new forward sales by Australian mining firms, which have been tempted by a very weak Australian dollar. It is also possible that some troubled hedge books may have been consolidated at Chase to take advantage of its expertise in this area. So again, as is always true with derivatives and hedge books, it is impossible to arrive at very definite conclusions without more knowledge of the underlying details. Still, given the size of the increases and the general circumstances in the gold market during the quarter, it is very hard to see how the bulk of these increases could represent normal commercial or producer business.
Another strange aspect of the startling growth in the notional amounts of gold derivatives over the past two quarters is that it has been paralleled by an equally striking slowdown in the average daily volume of gold transactions on the LBMA, where many of these OTC derivatives are sold and hedged. The following table shows these figures from June 1999 through April 2000, the most recent month for which there are clearing statistics:
                   Ounces
      Month      Transferred        Value         Number of
                   (tonnes)     (US$billions)     Transfers

      Jun-99         948.6           8.0            1044
      Jul-99        1082.4           8.9            1043
      Aug-99        1132.1           9.3            1034
      Sep-99        1153.9           9.8            1087
      Oct-99        1157.0          11.5            1205
      Nov-99         786.9           7.4             845
      Dec-99         886.4           8.1             942
      Jan-00         690.5           6.3             774
      Feb-00         933.1           9.0             907
      Mar-00         752.7           6.9             800
      Apr-00         783.8           7.1             791
January, March and April of this year show the lowest average daily clearing volumes as measured in all three categories since the LBMA began reporting these figures in October 1996. November and December 1999 also show volumes far below historic norms. This pattern, too, is consistent with protective hedging for the recent large increases in the banks' gold derivatives coming from other than normal sources, almost certainly official.
From the BIS: Pulled Punches and Indications of Strain. On June 5, 2000, the BIS held its annual meeting and released its annual report for the year ending March 31, 2000. The report is unusual for the candor with which it covers the major dangers facing the world economy. But this hard-hitting approach turns to pulled punches when the BIS addresses the gold market (pp. 99-102), perhaps a sign that here is where the greatest danger lies.
The British gold sales are not mentioned, just that the gold price "trended downwards...to a low of $254 in late August." This decline is attributed "to a surge in forward sales by gold producers,...[who] stepped up their hedging sales by more than 400% in the first three quarters of the year, an increase equivalent to about 10% of the total annual gold supply." The report continues: "In 1999, gold producers appear to have started to lock in their output prices at longer maturities (10-15 rather than 5-10 years), while banks in response were trying to lengthen the maturity of their gold borrowing beyond three to six months."
By not naming these foolhardy producers, the BIS spared them instant removal from most gold investors' buy lists. Less excusably, the BIS failed to address the real problems of the gold mining industry, including increasingly uneconomic production and dangerously ill-advised hedge books, both of which carry obvious and important long-term implications for gold banking, especially in its current highly leveraged condition.
Gold leasing and gold derivatives are mentioned only in the context of describing the Washington Agreement, which commits the signatory banks to no further expansion of either. A lengthy but rather inconclusive analysis on the effects of news about official gold sales on gold prices notes that if the Washington Agreement is "excluded from the list of positive events, they are on average followed by a small decline in the gold price." There is a table showing the largest official gold holdings segregated by banks who are parties to the Washington Agreement and those who are not, but no indication of the amounts of these reserves that are held in physical storage or are out on loan or swap agreements.
Accordingly, the BIS provides no enlightenment at all on the net short physical position, the exposure of the central banks or the bullion banks to possible gold loan defaults, the huge increases in the gold derivatives of certain major bullion banks in the last half of 1999, or the long-term ramifications of continued low gold prices on gold production. Rather, the general message that the BIS seems to want to convey is that "the global lowering of inflation expectations has reduced gold's attractiveness" and that "the gold market has seen a return to calmer conditions since [last October]."
A truer picture of the actual state of gold banking emerges from the operations section of the report, where the BIS describes its own gold banking activities during the past year. Briefly summarized, the picture here is less gold working harder. Gold deposits by central banks fell almost 12% from 927 tonnes to 819 tonnes, and gold assets also fell by 108 tonnes to 1018 tonnes. However, gold held in bars declined almost 20% from 813 tonnes to 658 tonnes, while total gold lending increased 47 tonnes to 360 tonnes, and accounted for over 35% of total gold assets versus 28% the prior year. All of the increase in gold lending was in time deposits over three months, while those under three months actually declined by a nominal four tonnes.
Looking at historical trends, total gold assets of the BIS remained stable from 1992 through 1996 at around 1500 tonnes, and have declined steadily since then by about a third to their present level just over 1000 tonnes. Over the same period, its total gold liabilities have declined in tandem, being always about 200 tonnes less than total assets to reflect gold held by the BIS for its own account. At the same time, its gold lending, which grew from 134 tonnes in 1992 to 185 tonnes in 1996, has since then almost doubled to its current 360 tonnes, with maturities over three months nearly doubling since 1997 as maturities under three months shrank, particularly from 1998 to 1999.
Since the BIS accepts deposits only from central banks, the decline in its gold liabilities suggests that at least some of its depositors have been under increasing pressure to use their own gold for other purposes. Similarly, on the asset side, the decline in gold bars and increase in gold lending also suggests increasing demand for physical gold. The BIS retains a reputation for great prudence in all its banking activities, and its balance sheet remains a textbook example of what sound gold banking should look like. Accordingly, one would think that running down deposits at the BIS would be among the last measures to which central banks in need of gold would resort.
Tightening Availability of Official Gold. My friend Elwood has very kindly updated his prior chart showing reductions in foreign earmarked gold at the N.Y. Fed along with total U.S. gold exports, imports and production on a monthly basis, and comparing them against daily gold prices. The figures for March indicate a sharp rise in imports to 46 tonnes, the highest level recorded in recent years. Fed outflows and total U.S. exports declined in March as gold prices retreated.
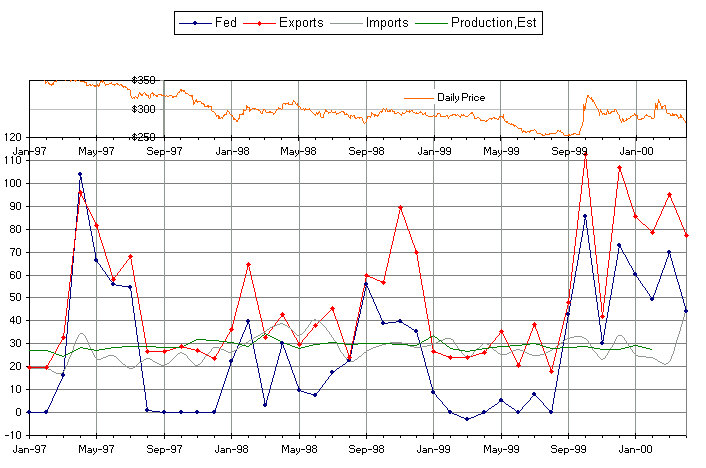
Interestingly, the sharp February spike in gold prices did not escape notice by the BIS in its annual report: "The second [major event since last August] took place on 7 February 2000, when [the price] leaped by about $20 per ounce within a few hours of the decision of a major gold mine [Placer Dome] to alter its hedging strategies. This change was, however, reversed over the next few days." The chart suggests that the gold which did the reversing came directly out of one or more foreign earmarked accounts at the N. Y. Fed. The BIS is silent on who engineered the reversal or why.
From Manipulation to Loss of Control. As the first major paper currency with no history of prior development from gold or silver, the euro was nevertheless supposed to draw strength from the large total gold reserves of the EA countries. Available to support the euro, these gold reserves are marked to market by the ECB quarterly. Some have hypothesized a more formal euro/gold link in the future, especially should the new currency run into serious difficulties.
However, unlike the Swiss National Bank or the BIS, neither the ECB nor its member central banks, at least as far as I can ascertain, report in any detail on their gold loans or gold derivatives. Accordingly, it is impossible to tell how much of their gold reserves are held in vault storage, to gauge their potential exposures on gold loans or gold derivatives, or to measure their compliance with any parts of the Washington Agreement.
Extrapolating from the gold loans reported by the SNB at the end of 1999 (see commentary on Swiss gold sales), I calculated that if all EA central banks had loaned 10% of their official gold reserves, total gold loans for the group would be approximately 1250 tonnes. Further support for this 10% estimate can be found in The 1998 Gold Book Annual, where Frank Veneroso reports (p. 27) a statement by the Bundesbank suggesting that "it has lent perhaps 10% of its 3,700 tonnes of gold." From 1995 through 1998, total reductions in foreign earmarked gold at the N.Y. Fed amounted to 1245 tonnes. Taking Fed Chairman Alan Greenspan at his word regarding the observed purposes for which foreign central banks lease gold, I suggested the possibility that these outflows reflected leased gold fed into the market to cap rallies in the price.
Perhaps the reappearance of the 1250-1300 tonnes figure in these three contexts -- Swiss gold sales, EA central bank gold loans, and outflows of foreign earmarked gold from the Fed -- is coincidence. But it is also consistent with the hypothesis elaborated in some of these commentaries: a coordinated official scheme to control the gold price originating in 1995 as part of a larger plan by the major industrial nations for the economic rescue of Japan. See Two Bills: Scandal and Opportunity in Gold and War against Gold: Central Banks Fight for Japan. For the Europeans, this plan would have had the added attraction of maintaining relatively calm international monetary conditions for the introduction of the euro on January 1, 1999, when the scheme could be wound down and gold allowed to run free.
The whole idea of Swiss gold sales seems to have originated in 1996 with former Fed Chairman Paul Volcker's efforts to mediate the Holocaust claims against Swiss banks. As one Swiss citizen told me recently: "The SNB was talked into selling gold by P. Volcker, who likes neither gold nor the Swiss." Thus, the timing fits as well as the amounts. What is more, after the Swiss by popular referendum rejected joining the European Union, they had far greater incentive to go along with gold sales plan if it would buy them, in addition to a settlement for their banks, effective inclusion in the EU while remaining formally outside it.
From a European perspective, then, the successful introduction of the euro in January 1999, coupled with increasing doubts about the continued efficacy of Japan's zero interest rate policy and rising concern over too much distortion in the gold market, dictated an end to coordinated official efforts to cap the gold price. Accordingly, as the chart above shows, outflows of gold -- leased or otherwise -- from the foreign earmarked accounts at the N.Y. Fed ceased. Indeed, in the fall of 1998 during the Russian default and the Long Term Capital Management debacle, these outflows for the first time in several years fell considerably short of almost fully covering a spike in U.S. gold exports.
But if the Europeans were ready to free the gold market, the Americans and British were not. First they pushed for IMF gold sales, against considerable European resistance, particularly from Germany, making the German banks' activities in the gold market all the more peculiar. As the IMF's plan ran into trouble and gold rallied early in May 1999, the British Treasury on May 7 announced its wholly unanticipated program of gold sales. All these developments have been discussed in detail in prior commentaries (see esp. The ESF and Gold: Past as Prologue), as has the European response: the ironically named Washington Agreement of September 26, 1999.
It took nearly five months for the Europeans to react effectively to the British announcement, during which time the bullion banks engaged in an orgy of derivatives writing predicated on the prospect of ever lower gold prices. What is more, it now appears from available numbers that the original plan to control gold prices had already by January 1999 created a dangerously large short gold position, far greater than that apparently anticipated by planned Swiss gold sales. In any event, when the turn came as a result of the Washington Agreement and the gold price rallied far more sharply than almost anyone expected, many were caught very wrong-footed and the full contours of the gold shortage began to emerge.
So far, the only apparent strategy for dealing with this desperately short gold market is to throw ever larger amounts of gold derivatives at it. Since these derivatives are coming in huge volumes from the largest and best-connected American and German bullion banks, all under the direct supervisory jurisdiction of the Fed or the Bundesbank, it is very hard to believe that this explosion in paper gold does not have some type of official imprimatur. Still, it is even more difficult to think that this approach can lead to anything but a very bad end.
Nor does it appear coincidental under the circumstances that the banks writing these gold derivatives are based in the two countries -- the U.S. and Germany -- having the largest official gold reserves. Ultimately, if there is significant physical gold backing this deluge of paper, it resides in an implicit promise of access to these countries' gold reserves. But neither country has yet done anything to prepare its citizens for the possibility that their national gold reserves may be called upon to bail out the bullion banks, many of whom got into trouble initially by trying to profit from inside knowledge of official efforts to manipulate gold prices.
My guess is that when the European central banks announced the Washington Agreement, they were quite unprepared for either the strength of the ensuing gold price rally or the magnitude of the short gold position that it revealed. Probably they had in mind only short positions obvious from looking at their own books or contemplated in their original plan. What they may have failed to appreciate, or at least not fully, was the extent to which the bullion banks had taken advantage of their knowledge or perception of a rigged market to write gold derivatives for their own profit. Too late, the signatories to the Washington Agreement may have realized that some of their own gold loans were in jeopardy of default, and that in allowing the bullion banks to operate without either effective regulation or appropriate reporting geared specifically to gold banking, they had made a grievous error.
Thus, setting out to con the gold market, the central bankers may have ended up conning themselves. In the process, the ECB and EA central banks may also have unintentionally stymied effective use of their gold reserves to support the euro. The causes of its recent weakness are the subject of considerable debate, but to some extent the problem is more an overly strong dollar than an intrinsically weak euro. One solution for the ECB would be to sell dollars, which it has in abundance, not for euros, which it can create almost at will, but for gold. By announcing through practical action that gold rather than the U.S. dollar is the ultimate benchmark for the euro, the ECB would likely strengthen the euro's foreign exchange value and win popular plaudits in Europe for the new currency. But it would also risk setting off an even stronger rally in gold than did the Washington Agreement.
The very danger of that rally now seems to stand not just as the chief barrier to effective mobilization of the EA's gold, but as a potential springboard into the unknown, including quite possibly complete collapse of the dollar-based international payments system jury-rigged on the ashes of Bretton Woods out of unlimited fiat money and floating exchange rates. Gold was a hard master. But no master may turn out to be far worse.
Central bankers no more lack for money or brains than Bill Gates. Nor do their considerable resources confer any greater exemption from basic laws of the market place and human nature. If GATA's Bill Murphy putting out the truth about the gold market on the internet does not start the central bankers sweating, perhaps Ed Murphy will. He is the American engineer who coined in the twentieth century the principle known as Murphy's Law, given milder but more eloquent form two centuries earlier by the Scottish poet Robert Burns in To a Mouse (On Turning Her Up in Her Nest with the Plough):
            The best laid schemes o' mice an' men
                        Gang aft a-gley,
            An' lea'e us nought but grief an' pain
                        For promis'd joy.
May 26, 2000. Gold: Can't Bank with It; Can't Bank without It!
The huge jump in the gold derivatives of Deutsche Bank and Dresdner Bank in the last half of 1999 invites all sorts of speculation, particularly when coupled with similar increases at Morgan Guaranty Trust Co. and Citibank. But as intriguing as such speculation is, it should not be allowed to obscure the more important as well as more factual story that resides in the larger BIS numbers of which the figures for these four banks are only a part.
Much has been written recently about the short position in gold. In its narrowest sense, this short position is the accumulated physical gold transferred by deposit (loan) from central banks and others to bullion banks. This gold creates deposit liabilities on the balance sheets of the bullion banks. It must be repaid in gold. Virtually all of it has been sold by the bullion banks into the market, creating various paper assets on their books. Besides central bank deposits, gold deposit liabilities of bullion banks include unallocated gold, often in certificate form, of private parties. But the key point is that this physical gold has left the vaults of the banks and the control of the bankers. It can only be replaced by new production or market purchases, and thus constitutes a net short physical position of the bullion banks.
The total net short physical position of the bullion banks is reliably estimated at between 7000 and 10,000 tonnes, although it could be higher. Ultimately its size is limited by the willingness of gold owners to lend and of gold users (e.g., producers, fabricators, bullion banks, speculators) to borrow. Prudence dictates that the net short physical position be quite reliably hedged, e.g., delta hedging in physical bullion, contracts for forward delivery from gold mining companies, call options on central banks with large gold reserves, or other instruments where the risk of counterparty default on the obligation to deliver physical gold appears minimal.
In a perfectly prudent world, the net short physical position would roughly correspond with the net short gold derivatives position. However, in the absence of such a world, the net short gold derivatives position tends to be larger than the net short physical position. This phenomenon results because while part of the gold derivatives position may be hedged in the physical market or reliable substitutes, other parts may be hedged in less reliable forms of paper gold or even unhedged, such as naked calls.
As discussed in an earlier commentary, writing naked call options can be a very effective means of adding gold to the derivatives market, thereby putting downward pressure on the gold price. Of course, writing naked calls is also a very risky activity. But it demonstrates a key point: the net short gold derivatives position is ultimately limited only by the prudence of the least cautious players and, if applicable, the willingness of governments or other official agencies to back them.
As summarized in tabular form in the prior commentary, the recent figures from the BIS on the total size of the gold derivatives market are important because they suggest: (1) that the central banks may have loaned much more gold into the market than previously thought; and/or (2) that the net short gold derivative position is far larger than suspected or than anyone would deem prudent.
Before addressing these two alternatives, three points about the BIS figures should be emphasized. First, under the Basle Capital Accord, all off-balance-sheet exposures, specifically including gold derivatives, are subject to the capital adequacy standards. Second, the Basle Committee on Banking Supervision has adopted a number of recommendations "to encourage banks and securities firms to provide market participants with sufficient information to understand the risks inherent in their trading and derivatives activities." And third, the statistics released semi-annually by the BIS on the global OTC derivatives market are an integral part of this risk assessment and disclosure process. A wealth of further information on all these subjects is available at the BIS's website (www.bis.org).
Turning specifically to the derivatives market statistics, the consolidation of notional value at the BIS level is intended to eliminate double-counting between reporting banks and dealers so that the total notional figure is in effect a measure of market size at a point in time. It is not turnover such as reported by the LBMA. For commodities and gold, the closest analogue would appear to be open interest on a commodities exchange. But OTC contracts being non-standard, counting the number of contracts obviously does not work. Accordingly, the best way to measure them is by underlying contract amounts or face values, halving those between reporting parties and taking other steps, as the BIS does, to avoid double-counting.
At the end of 1999, the BIS put the total notional amount of gold derivatives at US$243 billion, up from $189 billion at the end of June. Converting the year-end notional amount to tonnes at the year-end gold price ($290/oz.) gives just over 26,000 tonnes. Using a $300 gold price gives around 25,200 tonnes. However, these 1999 figures are for major banks and dealers with their head offices in the G-10 countries only.
On a more irregular basis, the BIS collects similar information for as close to the whole world as it can. Its last larger survey as of the end of June 1998 showed a total global figure for gold derivatives of $228 billion compared to a G-10 figure on the same date of $193 billion, indicating that at that time there was an additional $35 billion (or 3629 tonnes @ $300/oz.) in gold derivatives outside banks and dealers headquartered in G-10 countries. Accordingly, assuming a continuing difference of around the same magnitude, the total global gold derivatives market is on the order of 26,000 to 28,000 tonnes, more than twice the higher estimates of the net short physical position, and almost as large as the stated gold reserves of all the world's central banks put together.
What does this number mean? How should it be interpreted? Is it really as large as it looks? Analysts are unlikely to agree. I look at it this way. If the net short physical position is 10,000 tonnes, and if that position has been fully hedged (far from certain), the total notional value of all that business should be around 20,000 tonnes. In that event, using 26,000 tonnes as the total notional amount for all gold derivatives, the net short gold derivatives position -- over and above the net short physical position -- is about 6000 tonnes, and the bullion banks have undertaken to deliver this amount in addition to what they must deliver to cover the net short physical position of 10,000 tonnes.
In other words, as I define it, the net short gold derivatives position is the amount by which the total notional value of all gold derivatives exceeds twice the net short physical position, and it must be added to the net short physical position to get a total net short position, i.e., the amount of gold that the bullion banks are committed to deliver on their outstanding paper. This formula effectively assumes that the net short physical position is fully hedged with zero risk of default but that any derivatives position in excess of twice the net short physical position represents a short position without reliable hedges in physical gold. [For a fuller explanation of the reasoning behind this formula, see the explanatory note at the end of this commentary.]
To return to the two alternatives posed earlier, is it possible that the physical gold borrowings underpinning total notional gold derivatives are larger than thought, thereby reducing, assuming they are credibly hedged, the net short gold derivatives position?
Of course it is. Here are the obvious possibilities. One, the central banks have on a net basis leased more gold than thought, thereby increasing the liquidity base of the gold derivatives market. Two, the central banks have on a net basis sold more gold than thought, and this gold has remained within the gold banking system, i.e., sold to investors or others who have deposited it in unallocated accounts. Three, the central banks have written covered calls in far greater volume than thought, thereby providing an additional sound base for gold lending. All these possibilities require that the central banks on a net basis reduce their combined official gold reserves by much more than they have suggested they are willing to do or have done.
Indeed, looking at what central banks say and allowing for significant private lending as well, it is very hard to come up with even 7000 tonnes as a net short physical position. In that case, the net short gold derivatives position would be 12,000 tonnes (26,000 - 2 x 7000), and the bullion banks are in even more parlous condition under my rough formula. But whatever the exact numbers, and whatever the motives of some of the bullion banks or the officials who have supported them, there is a far more fundamental but apparently unrecognized problem here. By historic standards, the bullion banks are operating with wholly inadequate gold capital and gold reserves for the very extensive gold banking business that they have built.
Everyone, bankers and regulators alike, appears to have assumed that gold derivatives are a more or less ordinary variety of commodity derivative. However valid this assumption may be for markets like the COMEX or the TOCOM having open interest of only a few hundred tonnes, or for a single bullion bank with gold derivatives of similar size, it is dangerously false as applied to a total gold derivatives market where deposits or their equivalent exceed 10,000 tonnes. Exposures that amount to but fractions of annual new production are one thing; a total exposure equal to several years of new production is quite something else.
The Basle Capital Accord provides two methods for determining capital adequacy for off-balance-sheet gold derivatives: the current exposure method and the original exposure method. Without going into all the details of these formulas, which are basically the same as for exchange rate derivatives, suffice it to say that the capital adequacy requirements range from 1% of total notional value for maturities under one year to 7.5% (or higher under the original exposure method) for contracts over five years. These percentages are less than those for equity, other precious metals or other commodities derivatives. Furthermore, there is no requirement that any of the necessary capital be held in gold bullion.
Under this regime, largely on the basis of deposit liabilities by the central banks and others amounting to something like 10,000 tonnes, the bullion banks have built a gold lending business of equal size, to which they have added a net short derivatives position of another 6000 tonnes. All this has been done at gold prices in the $300/oz. neighborhood. And so far as can be told, almost all the gold deposited with the bullion banks has been sold into the market and disappeared from the gold banking system to India and other parts of the Middle East and Asia.
Accordingly, where by traditional standards the bullion banks should be holding in their own vaults on the order of 5000 to 6000 tonnes of gold reserves, under the new gold banking paradigm they are apparently almost completely naked to about this same amount of gold liabilities. On an individual basis, perhaps, the gold derivatives business of some bullion banks may look like commodities trading. But taken as a whole, the gold derivatives business of all these banks has evolved into nothing less than full-scale gold banking, which done prudently has always required immediately available gold reserves equal to 35% to 40% of deposits.
This situation is ironic testimony to the true nature of gold as permanent, natural money. Bankers and governments could not abide the discipline of the gold standard, even in watered down forms such as the gold exchange standard or Bretton Woods. But even after expunging from the banking system any formal role for gold, neither the central banks nor the private banks capable of acting as bullion banks could resist the temptation to engage in gold banking. As money just lying around, the allure of gold proved too strong for the bankers, who now calling it a commodity, proceeded to reestablish an enormous gold banking business while disregarding all the prudential rules that several hundred years of gold banking experience had taught.
In the process, they fostered the illusion that low gold prices demonstrated confidence in their paper money system whereas in fact these low gold prices reflected only the reckless abandon with which they were creating paper gold liabilities in lieu of physical gold. These low gold prices had two further deleterious effects. First, they encouraged the flow of physical gold to parts of the world where gold's true value is still appreciated, and from which only much higher prices will cause it to return. Second, they decimated the gold mining industry worldwide, all as brilliantly set forth in John Hathaway's newest essay, The Folly of Hedging (www.tocqueville.com/brainstorms/brainstorm0067.shtml).
An old saying, long forgotten, is about to take on new life: "There's no rush like a gold rush, and no run like a bank run." In these circumstances, the safest gold is not in bank storage of any variety. It rests in more imaginative places: the snake pit, the closet with the black widow spiders, or buried in the backyard near the Doberman's bone and well-within range of his leash.
[Explanatory Note: The formula is essentially arbitrary, but reflects my view of market events. If the net short physical position is less than 10,000 tonnes, the net short derivatives position is larger, in which case more of it is likely to be effectively hedged. If the net short physical position is more than 10,000 tonnes, the assumption that it is fully hedged with no effective risk of default is even less tenable. A cursory review of Cambior's hedge book shows how shaky some so-called hedges on this short position were even prior to the Washington Agreement. Accordingly, it seems quite doubtful that bullion banks writing calls for the likes of Barrick in the wake of that agreement were able to hedge effectively, particularly with many mining companies trying to reduce their forward exposure. That the big increases in gold derivatives during the last part of 1999 were concentrated in just a handful of well-connected banks only adds to the doubts. However, I am assuming that any official support for the net short derivatives position is not included in the BIS figures on notional values.
Both sides of my equation have flaws: the net short physical position is certainly not perfectly hedged; and some of the net short derivatives position may encompass adequate hedges -- from official sources or otherwise -- for what appear to be mostly short positions. What I am guesstimating is that assuming a net short physical position of around 10,000 tonnes, these two sets of errors more or less offset each other. And what I am further suggesting is that even if the net short physical position is adjusted up or down, the exposure on the net short derivatives position remains at roughly the same order of magnitude.]
May 20, 2000. Deutsche Bank: Sabotaging the Washington Agreement?
In a prior commentary, I suggested that the Swiss gold sales of 1300 tonnes over the next four and one-half years are likely aimed at covering gold loans made by European central banks, and that the quid pro quo for the Swiss is effective inclusion within the Euro Area even though Switzerland is not a formal member. Suspecting that Swiss gold sales might also be intended to cover gold loans to Swiss banks, especially from the Bundesbank, which is reported to have loaned out 10% of its total reserves of almost 3500 tonnes, I made an online search for further information on the gold derivatives of both the Swiss and the German banks. WOW!
UBS, of course, has been a leading bullion bank for years. With a total notional value at year-end 1999 of around US$74 billion, its derivatives position in precious metals is huge, approaching the $87 billion in gold derivatives of all U.S. commercial banks combined. But the gold derivatives position of Deutsche Bank is just plain stunning in the speed and magnitude of its growth, from almost nothing in 1996 to a total notional value of over US$50 billion, or nearly 5000 tonnes, at the end of 1999. Even more amazing are the lengthening maturities and accelerating growth in these derivatives during the last part of 1999, making it appear that Deutsche Bank is allied with Morgan in the same cabal to control the gold price.
Information on the precious metals derivatives of the Swiss banks is available at the website of the Swiss National Bank (www.snb.ch) in a publication entitled Les banques suisse (also available in German) at schedule 34. The great bulk of this business is done by UBS, and can be tracked in note 27 to its 1999 annual report and note 28 to its 1998 annual report, both of which are available at its website (www.ubs.ch). Credit Suisse does a much smaller business in precious metals derivatives, on which it also provides information in its annual reports, available online (www.de.credit-suisse.ch).
All these derivatives reports provide figures on notional amounts comparable to those in the OCC reports for U.S. commercial banks. However, the Swiss reports also use another measure: positive replacement value ("PRV") and negative replacement value (NRV). PRV, as described by UBS, "represents the cost ... of replacing all transactions with a receivable amount if all ... counterparties were to default." It is an asset on the bank's balance sheet. NRV, which is a liability on the balance sheet, "is the cost to the [bank's] counterparties of replacing all the [bank's] transactions ... if [the bank] were to default." The difference between the two is net market value, positive or negative. Generally the net difference is quite small, and to simplify the table below, PRV and NRV are averaged to make a single entry, which is given in Swiss franc billions. Not being notional amounts, these figures do not add to the total notional amounts stated. However, since PRV and NRV are the only figures given by maturity and line of business, I have used an average of the two to show the general distribution of the business.
The following table, compiled from these sources, shows the precious metals derivatives activities of the Swiss banks, of which more than 90% is almost certainly gold. Annual totals for UBS and Credit Suisse are slightly higher than the sums of their figures for over-the-counter forward contracts and options because both banks additionally report very small amounts of exchange-traded futures and options (almost all options). Additionally, the figures reported by the SNB do not reconcile completely with the UBS and Credit Suisse figures, but the apparent discrepancies are quite minor and probably due to some netting or other form of consolidation. Conversions to U.S. dollars and tonnes are at end of period rates and gold prices as shown in IMF, International Financial Statistics. Conversions to tonnes are discounted by 10% to exclude precious metals derivatives that are not gold.
                      Maturity            Total    Total   Tonnes @
             <3mos 3-12mos 1-5yrs >5 yrs Notional Notional Gold Pr.  Gold
  Year         (average of PRV and NRV)  SwF bil. US$ bil. Notional   Pr.

1999 UBS OTC
 Forwards     1.08   .06     .07   .0      30.0     18.8     1809    290
 Options       .25   .53    1.12   .12     82.9     51.8     4998
 Total        1.33   .59    1.19   .12    118.6     74.1     7151
1998 UBS OTC
 Forwards     4.59   .26     .07   .01     47.7     34.7     3371    288
 Options      2.88   .01     .0    .0      56.2     40.8     3971
 Total        7.47   .28     .09   .01    110.2     80.1     7787
1999 Credit Suisse OTC
 Forwards                                   17.5    10.9     1055    290
 Options                                    11.2     7.0      675
 Total                                      28.8    18.0     1736
1998 Credit Suisse OTC
 Forwards                                   18.8    13.7     1328    288
 Options                                    15.4    11.2     1088
 Total                                      34.8    25.3     2459
1997 Credit Suisse OTC
 Forwards                                   26.3    18.1     1758    290
 Options                                     8.6     5.9      575
 Total                                      36.7    25.2     2453
All Banks
  1999                                        not yet available      290
  1998 - Total                              133.7    97.2    9450    288
    Forward Contracts                        59.9    43.5    4232
    Options                                  65.5    47.6    4631
  1997 - Total                              144.8    99.5    9676    290
    Forward Contracts                        74.1    50.9    4954
    Options                                  60.3    41.5    4032
Several important points emerge from this table. First, of course, is the huge size of UBS's business, dwarfing that of Credit Suisse. Second, the size of both banks' business has remained relatively stable over the past three years, Credit Suisse showing small declines and UBS a slight increase as measured in Swiss francs. More interesting, however, is the shift in the mix between forward contracts and options, with the former declining and the latter rising. This trend, apparent for Credit Suisse in 1998, is very pronounced for UBS in 1999. Finally, from the average PRV and NRV figures, which are the only figures that UBS provides by maturity, one can detect a shift in options in 1999 from shorter to longer maturities, mostly from under 3 months to over 1 year.
Deutsche Bank acquired Banker's Trust in June 1999. Deutsche Bank's annual reports from 1996 through 1999 are available in English at its website (http://public.deutsche-bank.de), and give detailed information about its off balance sheet derivatives, including precious metals, of which again more than 90% must be gold. Dresdner Bank's 1998 and 1999 annual reports are also available online (www.dresdner-bank.com). The following table is drawn from all these reports. Except as noted, conversions to U.S. dollars and tonnes are at end of period rates and gold prices as shown in IMF, International Financial Statistics. Conversions to tonnes are discounted by 10% to exclude precious metals derivatives that are not gold.
                Maturity
  Year   <1 yr   1-5 yrs   >5 yrs    Total    Total   Tonnes    Gold
             (All in Notional Amounts)         US$     @Gold    Price
Deutsche Bank     in euros billion             bil.    Price
  1999    21.8     21.8      7.3      50.9      51.2    4934      290
  1999    average notional volume*    35.3      37.7    3738      282
                    in DM billion
  1998    20.0      6.4       .8      27.2      16.2    1579      288
  1997    21.8      1.0       .0      22.8      12.7    1226      290
  1996     8.6       .1       .0       8.7       4.8     367      369
Dresdner Bank     in euros billion
  1999**   8.3          6.9***        15.2      15.3    1472      290
                     in DM billion
  1998     4.9      3.6       .6       9.2       5.5     534      288
  1997     6.8      2.5      1.1      10.4       5.8     562      290

*  Conversions to US$ and tonnes at average 1999 rates and prices.
** Separately stated trading and investment portfolios summed.
***Includes over 1-5 years and later.
This table portrays a very disturbing picture. Deutsche Bank, the largest German bank, which had precious metals derivatives at the end of 1996 with a total notional value under US$5 billion, by the end of 1999 had grown this business to a total notional value in excess of $50 billion, or by more than 10 times in three years. What is more, a huge amount of this growth came in 1999, especially in the last half, as can be seen by comparing the average notional value for 1999 ($37.7 billion) with the year-end notional value ($51.2 billion). Note also that this growth was almost all in the longer maturities.
Nor can the 1999 growth in Deutsche Bank's precious metals derivatives be ascribed in any major way to its acquistion of Banker's Trust. Its OCC report for March 31, 1999, listed precious metals derivatives with a total notional value of around $6 billion, which by June 30 were just over $1 billion.
The 1999 figures for Dresdner Bank make it appear like the little brother aping his older sibling. There is the same surge in precious metals derivatives, with a similar move into the longer maturities. At a total notional value of $15.3 billion, only the absolute scale is smaller. Expressed in tonnes with a 10% reduction (probably too much) to exclude precious metals derivatives not related to gold, the total combined notional amount of the two German banks' gold derivatives at the end of 1999 exceeded 6400 tonnes, approaching twice the Bundesbank's stated gold reserves of 3470 tonnes.
The growth profile of Deutsche Bank's precious metals derivatives in 1999 closely matches that of Morgan Guaranty Trust, described in my prior commentary on Morgan. See also John Hathaway's article, JP Morgan To The Rescue, www.tocqueville.com/brainstorms/brainstorm0065.shtml. My Morgan commentary contains several paragraphs devoted to explaining the meaning of notional value in the context of gold derivatives and the risks implicit in large notional totals, particularly in a gold market that appears far out of equilibrium. Because this subject is a complicated one, I am planning to address it further in a future commentary.
However, the reports of the European banks contain data on replacement or market values that I have not yet found in the OCC data for U.S. commercial banks (although I believe it should be there somewhere). These values often but not always seem to move in a contrary direction from notional values. For example, the average PRV/NRV for Credit Suisse's total precious metals derivatives moved from SwF1.7 billion in 1998 to SwF2 billion in 1999 while total notional value declined. In contrast, the same number for UBS went from SwF7.8 billion in 1998 to SwF3.2 billion in 1999 while total notional value rose slightly. At the end of 1999, the total notional value of UBS's precious metals derivatives was four times that of Credit Suisse, but its replacement values were less than twice as great.
Deutsche Bank's replacement values are even more difficult to fathom, with average values over 1999 (PRV, E888 million; NRV, E818 million) more than four times year end values (PRV, E201 million; NRV, E153 million), notwithstanding that total notional value at year-end exceeded average notional value by more than 40%. Anyone familiar with the pricing of options knows how volatile the prices can be, and looking at gold prices in 1999, it is possible to hypothesize various scenarios to explain the apparently odd movements of replacement values versus notional values. But the real question is whether some of these seemingly low replacement values are suggesting that certain notional values may be misleadingly inflated.
Again, as with the hedge books of mining companies, it is almost impossible to reach sound conclusions without access to the underlying data. However, three considerations suggest that the high notional values for banks like Deutsche Bank and Morgan are more than insignificant fluff. First, other large bullion banks did not experience the same extraordinary growth in their gold derivatives in the last half of 1999. If market events by themselves had caused this explosion of notional values, one would expect to see some evidence of the phenomenon in the books of other bullion banks like Chase or Credit Suisse.
Second, replacement values appear principally intended as a measure of counterparty risk, not position risk. A footnote in Deutsche Bank's 1998 and earlier reports states: "Since exchange-traded products and short positions in options do not involve counterparty risk, no replacement costs are to be given here." Several prior commentaries have addressed the possibility that certain bullion banks, most likely with some form of official support, have been writing unhedged calls with specific intent to control the gold price. This note suggests the possibility that any such calls might not be included in replacement values even though included in notional values.
Finally, and perhaps most importantly, these figures are generated as a result of risk capital adequacy standards adopted under BIS sponsorship for all major banks and dealers in the G10 countries. Positions that do not require risk capital are typically netted out since no bank wants to burden its risk capital any more than is necessary. What is more, all these derivatives reports are consolidated semi-annually in reports available at the BIS website (www.bis.org, click on Regular Publications, then on Regular OTC Derivatives Market Statistics).
Under commodity contracts, gold is broken out separately, and notional amounts and gross market values are given. The figures for gold in the most recent report as of December 31, 1999, are shown in the following table, with conversions to tonnes at the corresponding end of period gold prices except as noted.
        Gold        Notional  Notional  Gross Market  Gold
        Contracts     Amounts   Amounts      Values     Price
                      US$ bil.   tonnes      US$ bil.

     Dec. 31, 1999      243       26,063       23        290
     June 30, 1999      189       22,524       23        261
                                  20,846                 282*
     Dec. 31, 1998      182       19,656       13        288
     June 30, 1998      193       20,281       10        296

     *Conversion of $189 billion at average 1999 gold price of $282.
Here again, a large increase in notional values in the last half of 1999 is accompanied by flat gross market values. Footnote 1 to the BIS press release accompanying the report states:
The notional amount, which is generally used as a reference to calculate cash flows under individual contracts, provides a comparison of market size between related cash and derivatives markets. Gross market value is defined as the sum (in absolute terms) of the positive market value of all reporters' contracts and the negative market value of their contracts with non-reporters (as a proxy for the positive market value of non-reporters' positions). It measures the replacement cost of all outstanding contracts had they been settled on 31 December 1999. The use of notional amounts and gross market values produces widely divergent estimates of the size of the overall market and of the various market segments.
The press release itself goes on to say: "Transactions involving gold, the largest single component of the commodity derivatives market, were particularly buoyant." It then notes the sharp rise in the gold price following the Washington Agreement, but makes no effort to relate the effect of this rally on notional values or gross market values. What is clear, however, from other footnotes is that the BIS attempts to adjust for double-counting, including halving notional values between reporting entities, and that it estimates some of these adjustments for the gold category.
Talking in tonnes in round figures, the BIS report shows a notional increase in gold derivatives of 4000 tonnes in the last half of 1999. According to the OCC figures, Morgan's gold derivatives increased by almost 1900 tonnes in the same period. There are no mid-1999 figures for Deutsche Bank, but with a year-over-year increase of more than 3200 tonnes, close to 2000 tonnes in the last half is not an unreasonable estimate. Add in Citibank (485 tonnes) and Dresdner Bank (over 900 tonnes on the year), allow for excluding some double-counting between the four, and it is not unreasonable to attribute virtually the entire increase in the last half of the year to these four banks, principally Morgan and Deutsche Bank.
The only major gold fund manager that I know who never owned a single share of Bre-X told me that he never bought the stock because: (1) even if you believed the company's story, the stock almost always looked too expensive; and (2) however great the ore deposit, large gold reserves are not built as quickly or as easily as Bre-X claimed to do. So too, the amazing emergence of Deutsche Bank from almost no gold derivatives business in 1996 to a book with a notional value approaching 5000 tonnes, larger by far than the book of any of the three principal U.S. commercial banks in this business, does not pass the smell test. Indeed, it is very hard to see any reason for the rapid creation of this huge position in gold derivatives other than to try to manipulate and control gold prices.
With gold closing strongly at $289.10 on May 6, 1999, up $2.10 on the day, and threatening $300 as the IMF's proposed gold sales sailed into trouble, Bill Murphy of GATA reported on Deutsche Bank the same evening in his Midas column at Le Metropole Cafe: "[T]heir bullion desk is calling their clients saying that the gold market is stopping at $290." [Emphasis in original, copy at www.gata.org/graham.html.] The British gold sales were announced the next day, May 7, 1999.
Why would Deutsche Bank participate in a cabal to cap the gold price, and far worse, continue to do so after the Washington Agreement? The Bundesbank is not only a signatory to this agreement, but also is rumored to have played a leading role in its adoption. For the Bundesbank to permit Deutsche Bank to act in this manner, with Dresdner Bank doing the same thing but on a smaller scale, suggests that long term monetary policy in the EA, particularly as it relates to gold, is in utter disarray, and that monetary cooperation between France and Germany is far more mirage than real.
Indeed, the implications of the gold derivatives activities of these two big German banks in 1999 are so mind-boggling that further analysis must await another commentary. Their actions threaten not merely to sabotage the Washington Agreement, but also, and much more seriously, to jeopardize the euro itself. Those who believe in sound money look to the Bundesbank as a light in the darkness. For it to conspire against gold is as unthinkable as the act of the great baseball player that brought forth this plea from one of his young fans: "Say it ain't so, Joe. Say it ain't so."