MPEG COMMENTARY - Page BA


May 8, 2002. Mike Bolser Further Updates His Study of Gold Manipulation on the COMEX

Upon Further Review: Preemptive Selling -- 1985 through March 2002

This commentary will update my COMEX gold preemptive selling series through March 2002. The non-random character of the conspicuous, high standard deviation preemptive selling events will also be described in some additional detail.

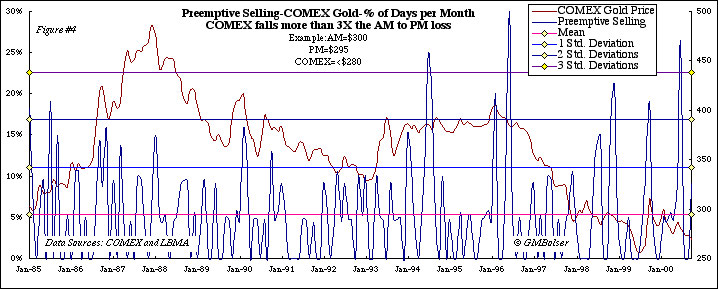
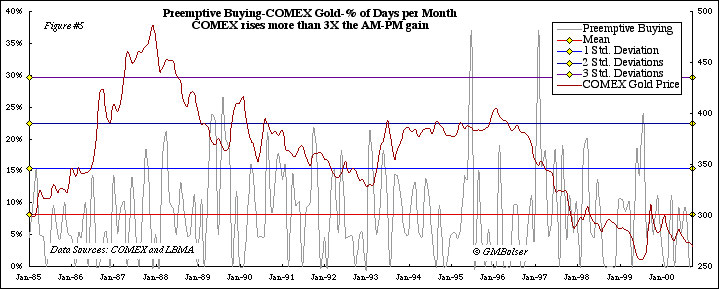
Recall that preemptive selling, which is a fraud detection algorithm, measures very aggressive COMEX gold market selling when compared to the London gold market (LBMA). Figure 1 displays the percentage of days per month in which the COMEX gold price falls 300% more than the London gold price. The probability of changing macroeconomics being the cause for such extreme New York price drops is highly diminished because the two markets trade the same commodity on the same day. Preemptive selling should not be confused with price volatility or rate of change, which are measures of rapid price fluctuation. In addition, preemptive selling is a measure of relative activity between two markets. Recall also that it does not measure the volume of comparative selling, only its effect as measured by gold market prices.

Figure 1

Figure 1 displays the preemptive selling record from 1993 through March 2002. Note the labeled spikes and their associated standard deviation values. (More on standard deviation below.) We can see also from figure 1 that the mean or average level of preemptive selling is shown by a red horizontal line that falls near the 5% of days-per-month point (left scale). Each standard deviation upward is represented by another, equally spaced horizontal line. The fourth standard deviation is shown with a dotted line near 28% of days per month. The price of gold is indicated with a yellow line with its 240 day moving average affixed in black.

The numbered spikes are correlations to other gold-related events as follows: (1) Federal Reserve assumes two board seats at Bank for International Settlements; (2) steadily rising gold price threatens to pierce $400; (3) important change downward in the long-term gold price; (4) failure of Long-Term Capital Management, reportedly involved in the gold carry trade; (5) Washington Agreement provokes sharp rise in gold prices; and (6) Canadian Imperial Bank of Commerce works to resolve Ashanti hedge book failure.

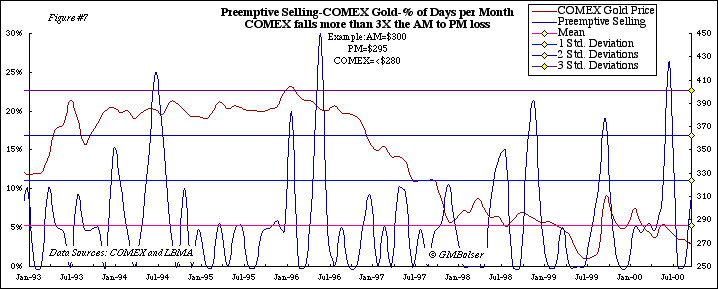
Looking at the detailed trace in figure 1, we see that preemptive selling was quiescent from May 2001 until December 2001, when it rose to significant levels. At this writing, the gold market shows signs of upward instability.

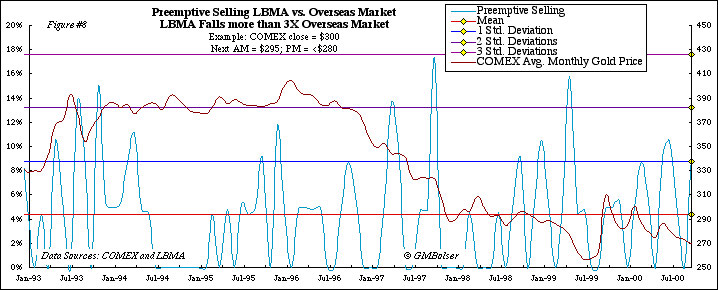
Figure 2

Figure 2 shows the full interval from 1985 through January 2002. The series has been divided into two epochs by the clustering of extreme preemptive selling events in epoch 2 and the absence of these extreme events in epoch 1. The demarcation between epochs appears to be the election of President Clinton. Each spike above 2 standard deviations is a rare, independent event. A cluster of such events encountered in a fifteen year plus series is even more extreme as their respective low probabilities must be multiplied to obtain the cluster's aggregate probability.

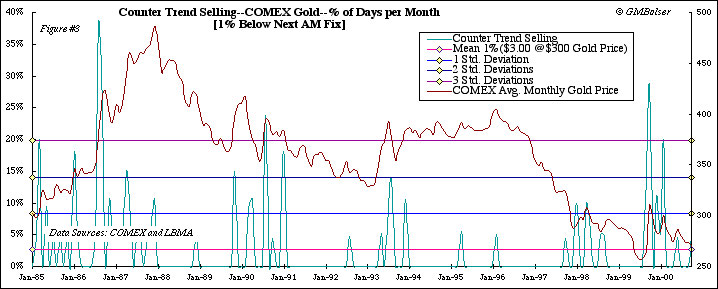
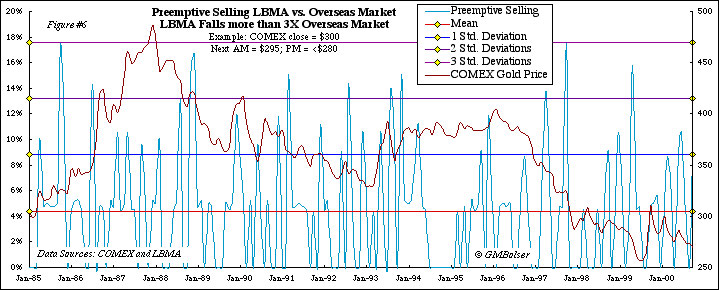
Figure 3

The updated counter-trend selling series is seen in figure 3. Counter-trend selling is defined as the London AM fix closing higher than the COMEX previous day's close. It represents selling against "overseas buying" as defined by Dr. Harry Clawar (www.gold-eagle.com/editorials_01/clawar020201.html). The very long, above-the-mean, counter-trend selling has abated somewhat. However, it remains persistently higher than random trading would suggest. Another way to regard the counter-trend selling at the COMEX is to think of it as strong overseas buying which is consistently met with COMEX selling. Clawar, a statistics professor, had this to say at the above link:

The pattern of selling down NY spot following an overseas gain is 3 times as likely as buying on top of that gain. Even though overall, losses in New York are more likely to occur than gains, they are MUCH more probable if there has been an overseas gain. This is a highly likely combination of patterns if the goal is to keep the price of gold low.

June 1996: Once in 1,538 Years

In past reports, I have referred to the June 1996 preemptive selling event as a four standard deviation event. Upon further review, it measures 4.22 standard deviations. Let us examine more closely the implications of these high standard deviation preemptive selling episodes.

We are all familiar with the idea of a bell-shaped distribution of, say, human height. Some people are tall (falling to the right on the curve), some are short (falling to the left), but most are "average" (falling in the middle of the curve). The shape of such a population resembles a bell, thus the term "bell shaped curve." In school many of us anxiously encountered the phrase "grading on a curve." With rare exceptions, it is the same phenomenon for any randomly distributed population. If preemptive selling truly were a random process, then its distribution must also be a bell shaped curve.

Figure 4

Figure 4 shows the rightmost portion (as if the bell had been vertically split) of what is known as a Gaussian distribution, a bell shaped curve of probabilities. The centermost portion of the "bell" is located at the mean or 1.0 on the horizontal axis. The other "half" (left) of the curve is not shown. The total universe of probabilities is equal to 1 (the total area under both halves of the bell-shaped-curve). The further one goes to the right, the smaller the remaining area and therefore the smaller the probability. Note how the standard deviation increases further out to the right. In very low probability events, one is limited to a tiny portion of the area under the bell-shaped cure. For example, a 1.0% probability means that 99% of the available chances (or in the case of preemptive selling, dates) are excluded.

The June 1996 preemptive selling event was a truly remarkable occurrence. According to chance, the Gaussian formula (inset in figure 4) reveals it would have been expected to happen only once in 18,450 months of trading or only once in 1,538 years of COMEX trading. The fact that this event happened within a cluster of other high standard deviation preemptive selling events further reduces, in a substantial manner, the already vanishing probability that the epoch 2 group of preemptive selling episodes is a natural phenomenon that just somehow happened "out of the blue." This is the basis of my original conclusion that these gold-negative, preemptive selling events could not have been the result of random market forces.

Michael Bolser
2215 Summit View Drive
Valrico, Florida 33594

May 2, 2002

The writer wishes to thank Bill Murphy, the Gold Anti-Trust Action Committee, Don Lindley and Reg Howe for their kind assistance.

June 18, 2001. Guest Article: Mike Bolser Updates His Study of Gold Manipulation on the COMEX

Preemptive Selling in COMEX Gold: An Update

By Michael Bolser

This article updates an earlier study, Anomalous Selling in COMEX Gold 1985 to November 2000, which I published in late 2000. It validated Dr. Harry Clawar's earlier findings of consistent, predictable COMEX selling against a rising overseas market component. Dr. Clawar has since published updated conclusions, which reveal that in four out of five trading days over a one-year period the COMEX closed lower than the London AM fix. My earlier study utilized the concept of preemptive selling, a condition that occurs when the dominant forces on the COMEX sell gold three times lower than the same day's decline on London market.

The World Gold Markets

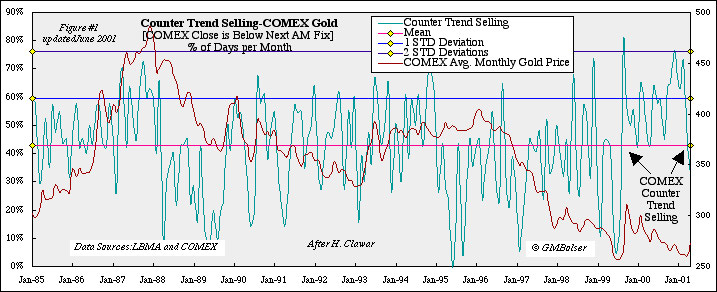
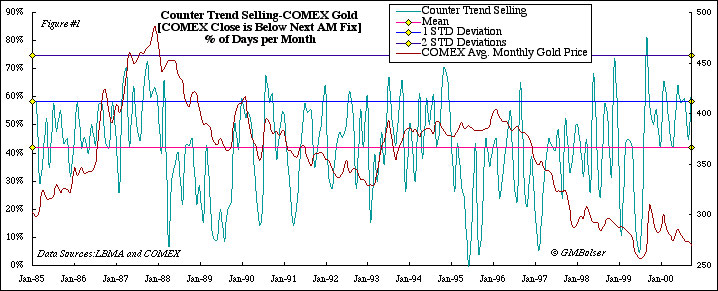
Counter Trend Selling Updated

Dr. Clawar's counter trend COMEX selling tests the hypothesis that the COMEX gold market can be predicted to close below the next morning's London AM fix. Predictable market behavior such as this represents abnormal and biased operations. Figure #1 below shows the updated series from 1985 through May 2001. Note that for over a year counter trend selling has stayed above the mean, indicating a sustained selling effort by the dominant forces on the COMEX. This selling continues to be predictable and runs counter to the activity in the overseas component of the gold markets.

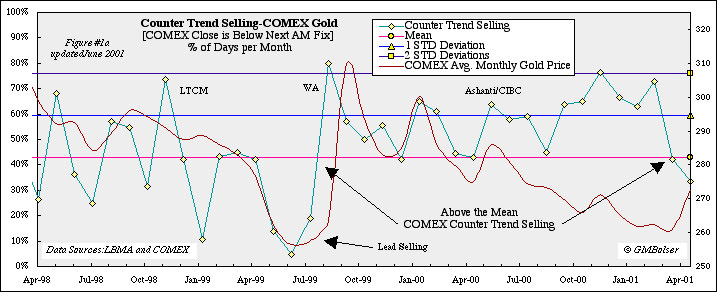
Figure #1

Figure #1a below presents an expanded resolution timeline. Note the drop in counter trend activity just prior to the Washington Agreement (WA) in September 1999. During that period gold exhibited horizontal pricing. Perhaps the implied intervention was no longer necessary. Then, late in September 1999, the rally in gold prices triggered by the WA called forth a far more aggressive intervention, resulting in a large spike in counter trend activity, which has persisted at high levels almost to the present.

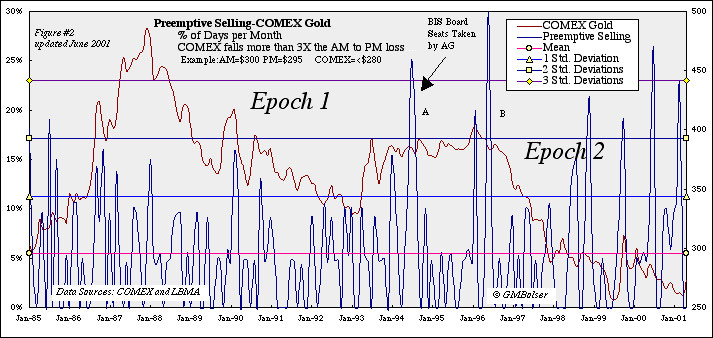
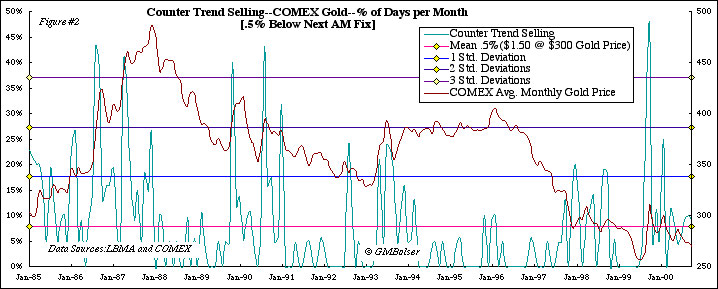
Figure #1a

Preemptive Selling Updated

By testing a relative condition between the COMEX and the London Bullion Market, preemptive selling is more sensitive at detecting trading patterns and their degree than a simple yes/no test. Figure #2 below is an updated and annotated chart from Anomalous Selling in COMEX Gold 1985 to November 2000. The series has been divided into two falling gold price epochs in order to highlight one of that study's several control mechanisms. The temporal resolution units are months. In a freely traded market, selling events in one price declining epoch should be similar to selling events in other price declining epochs. The original conclusion of clustered, anomalous selling behavior stands.

Figure #2

Figure #2 shows that extreme selling events have continued into the present year. The March 2001 event touches the three standard deviation ceiling. These three standard deviation selling events would be expected to happen only once in 83 years of COMEX trading (1,000 periods). In Epoch 1, there are no selling events which exceed two standard deviations. Epoch 2 contains seven such events. Event B, a four standard deviation selling event, would be expected to happen at random only once in 833 years of COMEX activity (10,000 periods). The implications of such an event are ominous. These extreme selling events started during the Clinton Administration. Perhaps not coincidentally, Event A occurred right around the time that the Federal Reserve, after a lapse of 64 years, assumed the two American seats on the board of the Bank of International Settlements. This aggressive selling effort nevertheless only affected the price of gold in a minimal way. Event B was necessary to break the resilience of the gold market, which thereafter fell into a major multi-year decline.

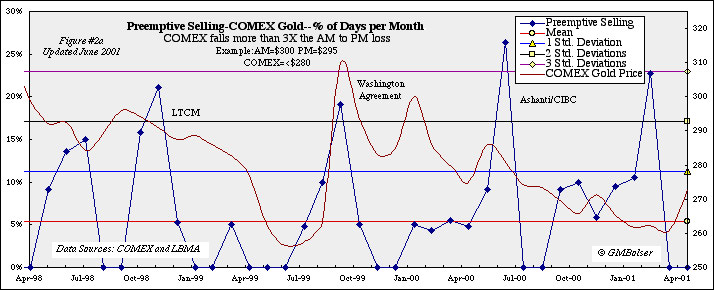
Figure #2a

Figure #2a above gives an expanded time line from April 1998 to today, including annotations relating the over two standard deviation preemptive selling events to related market events. As yet there are no obvious market events to associate with the March 2001 spike. However, at least until very recently, counter trend selling has remained remarkably high around this March preemptive selling event. Perhaps more effort has been required to suppress the price of gold than in prior periods.

Conclusion

These updated figures show a continuation of the abnormal COMEX gold trading pattern that began in 1994, including another in a series of high standard deviation selling events. These extreme selling episodes did not happen prior to 1994. The updated figures also validate for the first part of 2001 Dr. Clawar's observation that the COMEX gold market follows a predictable pattern of selling against a rising overseas price component. Such a market trading pattern cannot be regarded as random. The recent slight reduction in counter trend selling below the mean should be watched. It could indicate the beginning of a significant change in trend.

G. Michael Bolser
Valrico, Florida
June 15, 2001

The author wishes to thank the Gold Anti-Trust Action Committee, Bill Murphy, Reg Howe and Don Lindley for their kind assistance.

© Copyright November 2000 No reproduction of this material is allowed without written permission from the author.

December 6, 2000. Guest Article: Evidence of Gold Manipulation on the COMEX

Mike Bolser was introduced to readers of The Golden Sextant in a prior commentary on October 8, 2000, Charting the Gold Markets: Regressing to ?. He is the analyst who has been working with the proprietor to produce the special section containing regression charts on certain parts of the gold market. Now he has outdone himself with the following article that should be of great interest to anyone with an interest the gold market.

Anomalous Selling in COMEX Gold, 1985 to November 2000

By Michael Bolser

Abstract

Official pricing data for gold have been obtained from The London Bullion Market Association (LBMA) and New York Commodities Exchange (COMEX) for the purpose of comparative analysis. COMEX market activity is analyzed by measuring anomalous events in up and down trends. These events are referred to as counter trend and preemptive activity and are presented via statistically annotated charts. The results from the COMEX are compared with a similar control study of the LBMA. Our findings reveal that numerous episodes of anomalous COMEX selling and buying have exceeded three standard deviations in frequency where none occurred at the LBMA. Moreover, there is an asymmetry between extreme COMEX buying and selling events. In addition, the extreme COMEX selling events are biased towards the second half of the period compared with a random distribution pattern at the LBMA. Six of the seven highest COMEX preemptive selling episodes greater than two standard deviations have occurred since 1994. Notably, the longest period of consecutive, above the mean counter trend selling (14 months) is occurring now. Counter trend selling, preemptive selling and preemptive buying are also charted with the average monthly COMEX price of gold for the complete period.

I. Introduction

Assertions of unusual gold selling activity on the COMEX have been steadily growing for the past two years. Anecdotal evidence implicating certain large banks with this behavior has also accumulated. Clawar reports a statistical bias towards selling in the COMEX gold market which erases what would otherwise be an overnight gain from those markets which operate after the COMEX close and before the LBMA opens. Clawar refers to these markets as the "overseas component" of the market cycle. However, a limitation of this work is the short period examined (less than 1 year) and uncertainty from some critics as to the daily settle prices. In order to more fully understand the incidence, character and degree of anomalous COMEX gold market activity, we have examined COMEX and LBMA gold daily trading patterns from January 1, 1985, to November 1, 2000, using officially obtained data. In addition, we introduce new definitions in order to more adequately reveal anomalous COMEX gold market activity in buying as well as selling.

II. Methods

COMEX computer diskettes were obtained for the years 1985-2000 through September. The remaining data were obtained by telephone from their statistics division. London Bullion Market data were downloaded from their website (www.lbma.org.uk).

The data were reduced via Visual Basic™ code to produce four columns: LBMA date, AM fix, PM fix, COMEX date and COMEX daily settle price. These entries were synchronized for differing holidays, partial or half days to yield a continuous data set. For each LBMA date and AM-PM price pair there is a corresponding COMEX date and spot settle price. Days per month were counted for the period and used to produce a frequency of anomalous activity measured in percent of days per month.

A logic array was constructed adjacent to the data columns in order to rapidly examine the data set for compliance with current and future definitions of anomalous activity. The sum of days for each month was then transferred to the main charting arrays. Additional array structure was added to yield mean, first, second and third standard deviations.

The definitions used in this paper test COMEX activity in a rising trend as well as a falling gold price trend. These data were then charted with mean, 1, 2 and 3 standard deviations shown as horizontal bars through the period. Each definition's mean and standard deviation calculation has been hardened by over 3880 measurements. Thus any distant excursions above two standard deviations must be considered as extreme. Each mutual trading day from January, 1985, to November 1, 2000, has been recorded.

Note: As a result of the structural accuracy of the logic array, the onset of anomalous activity can be isolated to a single, specific date. The effect of that activity on the daily price of gold can also be detected with similar accuracy. (Charts showing this relationship will be presented in a future paper.)

III. Definitions

The following descriptions briefly outline the market pricing criteria used to record or reject a particular date in the interval January, 1985 until November 1, 2000 for the purposes of analysis. A control study was also completed in order to test preemptive selling at the LBMA gold market compared to the overseas component.

Counter Trend Selling: A date is recorded in the logic array if the COMEX close falls below the next morning's AM fix. A captured event represents COMEX selling activity when the non-COMEX /LBMA market component is rising and is a true/false detector. This definition compares the closed New York market with all other open markets until the LBMA established the next day's AM fix. Example of a captured event: AM fix $300, previous COMEX close is less than $300.

Counter Trend Selling by greater than 0.5% of the PM close: A date is recorded if the COMEX close falls below the next morning's AM fix by greater than 0.5%. Example: AM fix $300, previous COMEX close is less than $298.50.

Counter Trend Selling by greater than 1% of the PM close: A date is recorded if the COMEX close falls below the next morning's AM fix by greater than 1%. Example: AM fix $300, previous COMEX close is less than $297.

Preemptive Selling and Buying: A date is captured if during a downtrend (as measured by PM being less them AM), the COMEX close is less or more, respectively, than that day's PM fix by 3 times the AM/PM price loss or gain. This definition compares COMEX late day gold market activity with the LBMA's full day's activity. It is a direct indicator of New York influence on a single day's gold price activity exclusive of the non-LBMA markets. Examples of preemptive selling: (1) AM $300, PM $295, COMEX is less than $280; (2) AM $300, PM $299, COMEX is less than $296. Example of preemptive buying: AM $300, PM $301, COMEX is more than $304. Preemptive selling or preemptive buying detect extreme COMEX activity relative to the LBMA.

Control Study - Preemptive Selling LBMA: A date is captured if during a downtrend (as measured by AM being less than the previous COMEX close), the PM close is less than the previous day's COMEX close by 3 times the AM/PM price loss. This definition measures the LBMA gold price movement relative to overseas activity after the COMEX close.

Normal market activity is represented by random fluctuations within limits. We expect that market activities would exhibit relative symmetry during price rises and falls throughout the time range of 1985 to November 2000. We also expect to find similar general patterns of activity between the LBMA and COMEX gold markets. It should be noted that the definitions used in this paper do not measure the volume of trading, futures or options activity.

IV. Discussion

Figure #1

Figure #1 above shows the full time span from 1985 to November 2000. The frequency of counter trend selling expressed in percent of days per month is shown on the primary axis. The average monthly price of gold is shown on the secondary axis. The longest period of above the mean counter trend selling (14 months) is occurring now. This finding agrees well with Clawar's report of a recent market selling bias. Note also that the highest frequency of counter trend selling occurred in the fall of 1999 right after announcement of the Washington Agreement.

Figure #2

Figure #2 above, which shows counter trend selling by 0.5%, indicates that this more aggressive selling activity can be seen throughout the period from January 1985 through October 2000. By measuring the degree of counter trend selling at 0.5% and also at 1%, we believe we are better able to assess it's character and intensity. The 0.5% counter trend selling activity appears to have a marked depressive effect on the price of gold. We draw the reader's attention to the summer of 1986 during the sharp rise in the price of gold. There is a clear reduction in the price of gold after the first incidence of counter trend selling by 0.5% in excess of three standards deviations.

Figure #3

As indicated in figure #3 above, the summer of 1986 also provides the most aggressive incident of counter trend selling by 1%. In this upward gold price move, the data charted indicate that COMEX activity was followed by temporarily lower gold prices. Comparing the summer of 1986 to the Washington Agreement in the fall of 1999, aggressive counter trend selling occurred sooner in the course of the 1999 price rise than in 1986.

[It has been suggested that counter trend selling by 0.5% and 1% might miss events in an environment of high gold prices versus low prices. If true, this would bias the incidence of events in favor of low gold price regimes. We see by examination, however, that the incidence of extreme counter trend events of all three types appear at both ends of the period. Thus, if there is such an effect, it of second order magnitude. Preemptive selling activity is not subject to this potential effect since it utilizes relative comparisons.]

Figure #4

Figure #4 above reveals the extent of preemptive selling from 1985 to November 2000. Recall from the definitions that this event represents independent COMEX selling actions relative to the LBMA during the few hours in which it trades alone. One sees that six of the seven highest episodes have occurred since the summer of 1994. Moreover, there is a clear asymmetry between preemptive buying, as shown in figure #5 below, and preemptive selling. This is seen by the lack of associated extreme buying during the gold price rise of 1986 to 1987, while there is a clustering of selling events during the price fall of 1996 to the present. This striking market selling asymmetry is best seen during the gold price fall of 1988. In this interval, there are no extreme preemptive selling events compared to five such events in the gold price fall after 1996. We remind the reader that preemptive selling measures a condition where the COMEX price of gold has dropped three times more than that day's AM to PM price fall on the LBMA. This action occurs in just a few hours of trading.

Figure #5

Figure #5 above shows fewer extreme episodes of buying compared with selling even though there was a significant price rise during the period. Also, there are two conspicuous episodes of preemptive buying, but only one is associated with a significant gold price change. There are also fewer episodes above two standard deviations (five, with three barely above two standard deviations) when compared to preemptive selling, where there are seven episodes above two standard deviations. Although preemptive buying events occurred in the later years, including after the Washington Agreement, it is far less extreme than the selling events.

LBMA Control:

Figure #6

Inspection of figure #6 above reveals the random and therefore symmetrical nature of preemptive selling events in the LBMA control study. Also, there are an equal number of peak events comparing the first and second half of the interval. Observation also reveals that unlike the COMEX series, no LBMA preemptive selling event exceeded three standard deviations in number of days per month frequency. Of note, however, is an eight month period of quiescence beginning in July 1994 which seems to correspond with a sharp increase in COMEX preemptive selling.

V. Conclusion

There is a higher incidence of preemptive selling events above two standard deviations since 1994 compared with earlier periods. Therefore, there is a clustering of extreme selling events within the second half of the period compared with the first half of the period. The dominant COMEX selling forces which acted during the 1988-1993 price fall were far less aggressive than the selling forces acting on today's falling gold market. The magnitude of COMEX preemptive selling reveals an anomalous pattern of extreme events above three standard deviations compared with the LBMA control study. The two gold markets thus differ in their qualitative appearance. There were no events above three standard deviations in the LBMA study. This shows that a time selective, preemptive selling bias has existed since 1994 in the trading of gold on the COMEX. The frequency of extreme events has increased towards the end of the period suggesting a more aggressive application of preemptive selling by the dominant market participants.

There is less preemptive buying on the COMEX during periods of rising prices than there is preemptive selling during falling gold prices. Therefore, there is an additional bias in extreme events against buying in uptrends. The longest period of above the mean counter trend selling (14 months) has continued through November 1, 2000, which indicates that the principal COMEX selling forces are currently active. Finally, episodes of counter trend selling by 0.5% above three standard deviations have occurred since 1986, which means that anomalous counter trend selling of at least 0.5% and 1% in COMEX gold is not a recent phenomenon like preemptive selling.

G. M. Bolser
2215 Summit View Drive
Valrico, Florida 33594
November 21, 2000

The author wishes to thank the Gold Anti-Trust Action Committee, Bill Murphy, Reg Howe and Chris Powell for their generous support for this work.

© Copyright November 2000 No reproduction of this material is allowed without written permission from the author.


Addendum

Zoom charts providing higher resolution of figures #4 and #5 for the time period since January 1993, and a histogram comparing relative frequencies of preemptive selling on the COMEX and LBMA: