commentary37


CURRENT COMMENTARIES


August 7, 2011 (RHH). Constitutional Money: Don't Ask, Don't Tell

Reg Howe's speech at GATA Gold Rush 2011, The Savoy Hotel, London, England, August 4-6, 2011, is posted in Speeches under the title Constitutional Money: Don't Ask, Don't Tell.


November 22, 2010 (RHH). Gold Derivatives: Three Years of Contraction and Concentration

On November 16, 2010, the Bank for International Settlements released its regular semi-annual report on the over-the-counter derivatives of major banks and dealers in the G-10 countries and Switzerland for the period ending June 30, 2010, together with its triennial survey on the OTC derivatives of a wider universe of "non-regular reporters" from nearly 50 jurisdictions.

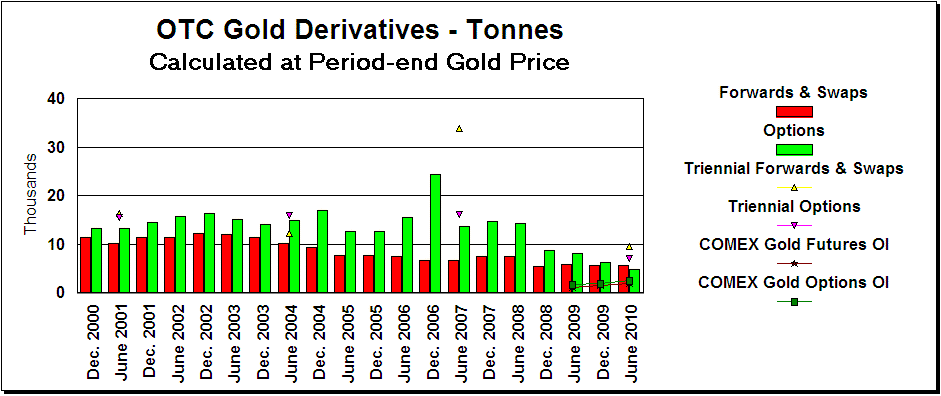
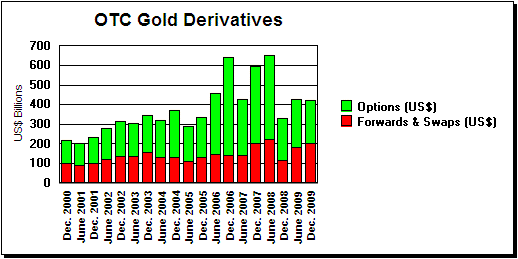
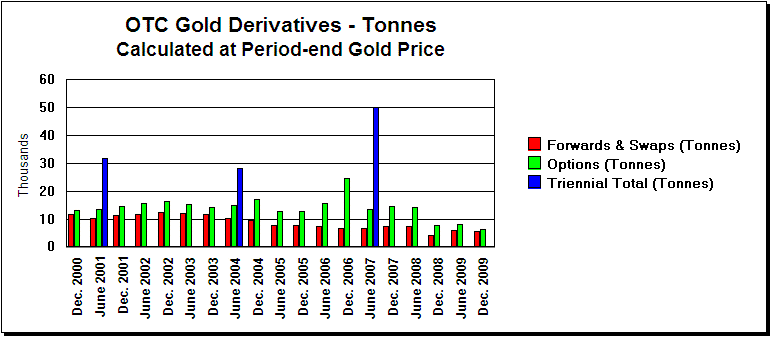
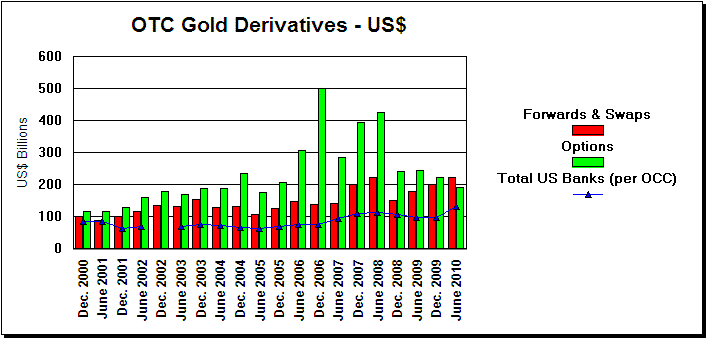
As detailed in table 22A of the regular report, notional amounts of gold forwards and swaps increased from $201 to $224 billion, while options fell from $222 to $193 billion. Converted to metric tonnes at period-end gold prices, total gold derivatives, which had fallen by over 2200 tonnes in the preceding six months, declined by another almost 1500 tonnes (from 11,918 to 10,426). Again, most of this decline -- over 1400 tonnes -- took place in options, which fell from 6255 to 4826 tonnes. Forwards and swaps held relatively stable, dropping by just over 60 tonnes (from 5663 to 5601).

The triennial survey showed very sharp contractions of notional amounts in both categories since the last triennial survey in June 2007. Gold forwards and swaps fell from almost 34,000 to just over 9600 tonnes, and options from just over 16,250 to 7100 tonnes. This year's triennial survey made no adjustment or correction to the total $1051 billion of gold derivatives reported in 2007. However, the BIS did note that there were fewer non-regular reporters this year than in 2007 due to some becoming regular reporters as a result of mergers or changes in ownership and others dropping out due to reduced business volume.

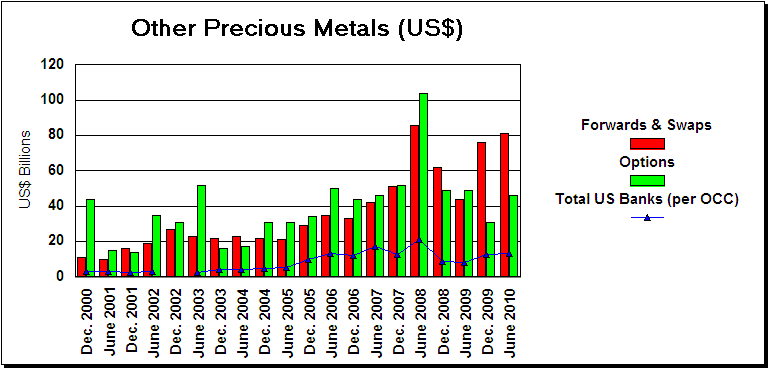
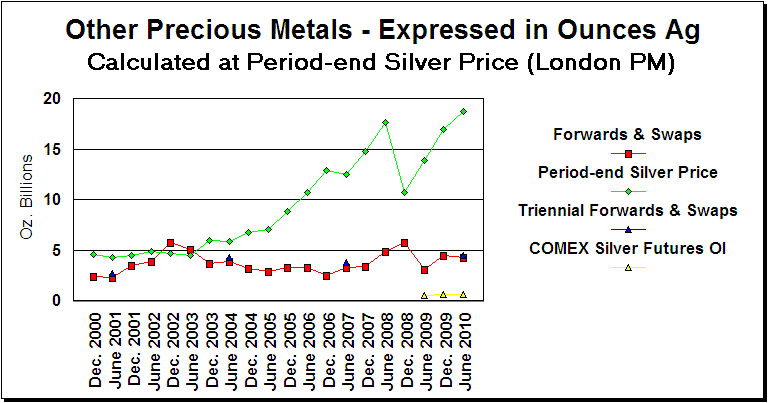
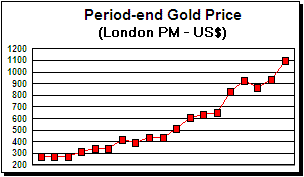
The data is shown graphically in the three charts below, all updated and somewhat modified versions of prior charts from previous commentaries on this subject. Several observations are in order.

As indicated on the chart of OTC gold derivatives in dollars, total gold derivatives held by U.S. commercial banks, principally JPMorgan Chase and HSBC, as reported by the Office of the Comptroller of the Currency have been rising relative to the totals for the G-10 plus Switzerland. Similarly, measured in tonnes, open interest in gold futures and options on the COMEX has been rising relative to OTC totals for both forwards and swaps as well as options.

Prior to 2003, open interest in COMEX gold futures rarely exceeded 200,000 contracts (622 tonnes); from 2003 through 2005, open interest was generally higher but seldom more than 300,000 contracts (933 tonnes). See chart in Gold Derivatives: Skewing the World (6/15/2005). By the end of June 2010, open interest in COMEX gold futures stood at 617,200 contracts or 1920 tonnes, twice the level of five years earlier, while OTC forwards and swaps had declined by almost one-third from 7761 to 5601 tonnes.

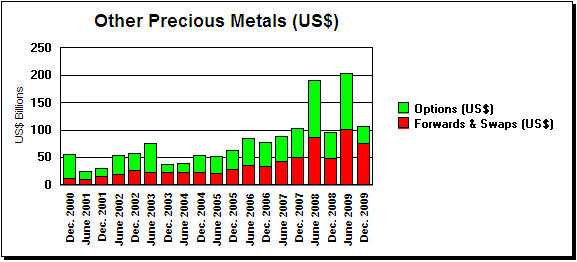
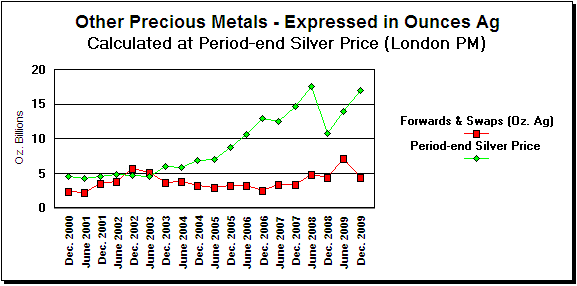
Turning to silver, which is the principal component of the "other precious metals" category, total OTC derivatives in both dollars and equivalent tonnes silver have not shown a similar decline as in gold. Nor are the other trends manifested in gold -- increasing size of OTC derivatives held by U.S. commercial banks and of COMEX open interest in futures and options relative to total OTC derivatives -- evident. Also, the triennial figures for forwards and swaps are scarcely higher than those for the G-10 plus Switzerland.

These differences are consistent with the bulk of the ammunition supporting OTC gold derivatives coming from central banks, which are increasingly withdrawing from gold lending. However, since central banks generally hold little or no silver, whatever metal supports OTC silver derivatives must come principally from private sources or China.

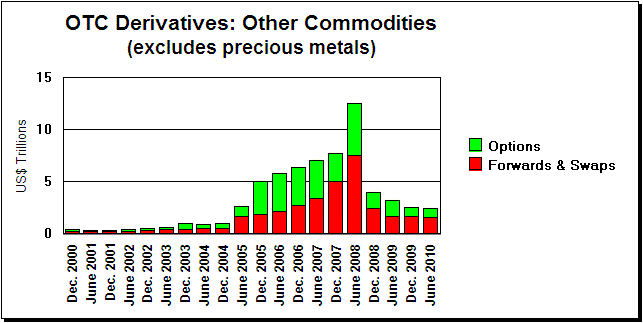
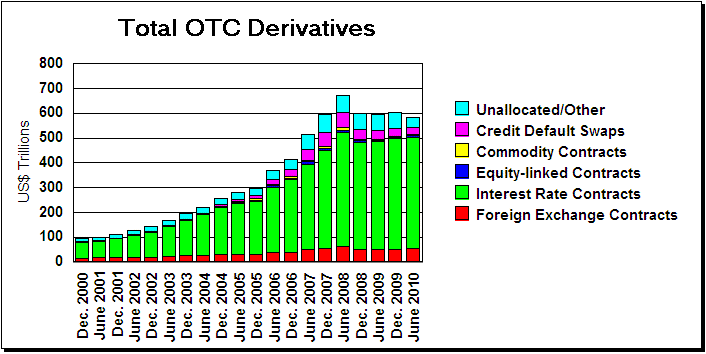
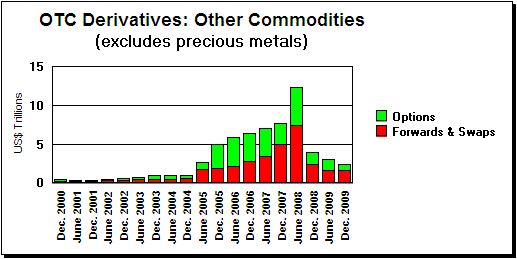
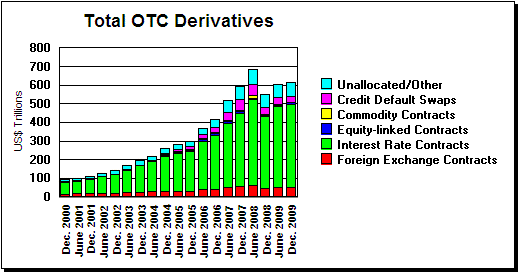
Addendum. For those interested, updates of the other charts on OTC derivatives contained in prior commentaries are reproduced below. Total OTC derivatives decreased marginally from an adjusted $604 to $583 trillion. Derivatives on other commodities (excluding precious metals) continued to decline, dropping from an adjusted $2.5 to $2.4 trillion. In both cases, it appears that the 2008 financial crisis reversed years of rapid growth.


July 14, 2010 (RHH). Gold Derivatives Update: BIS Swaps

As discussed in Gold Derivatives: GLD and Ass Backwardation (5/24/2010), the most recent figures on gold derivatives as reported by the Bank for International Settlements in its semi-annual report on the over-the-counter derivatives of major banks and dealers in the G-10 countries and Switzerland for the year ending December 31, 2009, showed surprising strength in gold forwards and swaps. An e-mail to The Wall Street Journal from the BIS further explaining a footnote in its own Annual Report 2009-2010 has now revealed a significant contributor to this strength: gold swaps between the BIS and commercial bullion banks backed by "gold bars held at central banks."

In Note 4A to its financial statements (at p. 163), the BIS stated:

The composition of the Bank’s total gold holdings was as
follows:

As at 31 March

SDR millions                          2010         2009
---------------------------------------------------------
Gold bars held at central banks     41,596.9     22,616.5

Total gold loans                     1,442.9      2,799.7
---------------------------------------------------------
Total gold and gold loan assets     43,039.8     25,416.2
---------------------------------------------------------
Comprising:

 Gold investment assets              2,811.2      2,358.1

 Gold and gold loan banking assets  40,228.6     23,058.1
---------------------------------------------------------

Included in “Gold bars held at central banks” is SDR
8,160.1 million (346 tonnes) (2009: nil) of gold, which the
Bank held in connection with gold swap operations, under
which the Bank exchanges currencies for physical gold.
The Bank has an obligation to return the gold at the end of
the contract.

Following publication of a story in The Wall Street Journal describing these "gold swap operations" as being with central banks, the BIS issued a clarifying e-mail: "The operations concerned were purely market operations with commercial banks." C. Cui et al., Commercial Banks Used Gold Swaps, The Wall Street Journal (July 7, 2010). As such, assuming the commercial banks involved were domiciled in the G-10 or Switzerland, the swaps to whatever extent in place at year-end 2009 were includable in the regular semi-annual report on OTC derivatives.

Not surprisingly, revelation of these swaps has generated considerable discussion, comment and analysis by students of the gold market. What appears to have happened is that one or more central banks loaned gold to one or more bullion banks, which then swapped the gold with the BIS for cash, leaving the physical metal in place. Under this arrangement, the accounting conventions promulgated by the International Monetary Fund allow the central bank or banks to continue to count the gold in official reserves while the BIS enjoys a high level of security on the gold side of the swap.

What is unclear is why the bullion banks needed or chose to raise cash in this novel manner, and why the central bank or banks were willing to provide such unusual accommodation. Commentators are largely in agreement that the additional liquidity provided -- 346 tonnes or approximately US$14 billion -- suggests that it was aimed at the gold market specifically, where this is a significant amount, rather than at any larger systemic issues, where it would be a drop in the bucket.

There is also general agreement that this injection of liquidity reflects some sort of stress in the gold market and is likely on balance bullish for gold prices. Indeed, were it otherwise, past practices suggest that both the BIS and the central banks involved would have issued press releases hailing these swaps rather than limit their public disclosure to an obscure footnote. But speculation that the swaps were effectively a bailout of troubled bullion banks requires quite a stretch from the known facts.

As Note 15 to its accounting policies (at p. 158) makes clear, the BIS in ordinary course makes "fixed-term gold loans to commercial banks." So, of course, do many central banks. What is unique about the 346 tonnes of gold swaps disclosed by the BIS is that the swapped gold was not sold into the market by the bullion banks but remained with the central bank or banks that leased it. In this respect the swaps present the same advantage as gold leased or swapped into GLD as discussed in the prior commentary: the metal stays within the banking system rather than going to adorn the women of India or to some other place where retrieval might require much higher prices.

This advantage comes at added cost to the bullion banks, for they must pay both lease rates to borrow the gold from the central banks and interest rates on the currency portion of their swaps with the BIS. But with lease rates at derisory levels and interest rates at historic lows, the added cost is minimal. In short, the gold swaps disclosed by the BIS appear well-adapted to the current realities of gold banking. They allow the bullion banks to fund their gold banking activities in more or less traditional fashion through gold loans from central banks while at the same time allowing the central banks to hold onto their gold rather than release it into an ever tightening physical market.

Overwhelming evidence -- much of it detailed here at The Golden Sextant -- supports the proposition that an integral part of gold banking in recent years has been the suppression of gold prices, not least by increasing the ratio of paper claims on gold to the underlying amount of available real metal. In this sense, if the new gold swaps disclosed by the BIS are just the latest technique for giving official support to an increasingly shaky gold banking business, they might be viewed as a short-term negative for gold prices. But in a larger sense, the growing reluctance of central banks to part with whatever gold they have left can only be a positive development for committed gold investors.


May 24, 2010 (RHH). Gold Derivatives: GLD and Ass Backwardation
You have to choose (as a voter) between trusting to the natural stability of gold and the natural stability of the honesty and intelligence of the members of the Government. And, with due respect for these gentlemen, I advise you, as long as the Capitalist system lasts, to vote for gold. G. Bernard Shaw, The Intelligent Woman’s Guide to Socialism and Capitalism, ch.55, p.263 (1928)

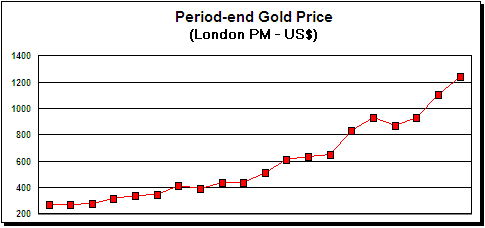
On May 11, 2010, the Bank for International Settlements released its regular semi-annual report on the over-the-counter derivatives of major banks and dealers in the G-10 countries and Switzerland for the year ending December 31, 2009. The total notional value of all gold derivatives remained virtually flat at $423 billion, a mere $2 billion less than at mid-year. With stronger gold prices ($1104 (London close) versus $935), gross market values rose from $43 to $48 billion.

As detailed in table 22A, forwards and swaps increased from $179 to $201 billion, while options fell from $246 to $222 billion. Converted to metric tonnes at period-end gold prices, total gold derivatives declined by over 2200 tonnes (from 14,146 to 11,918), almost fully erasing the increase of 2300 tonnes put on during the preceding six months. However, most of this decline -- over 1900 tonnes -- took place in options, which fell from 8188 to 6255 tonnes, as against an increase of 463 tonnes in the prior period. Forwards and swaps, which had risen by over 1800 tonnes in the prior six months, held relatively stable, dropping by less than 300 tonnes (from 5958 to 5663).

The data is shown graphically in the three charts below, all updated versions of prior charts in previous commentaries on the same subject.

With respect to gold forwards and swaps during the first half of 2009, the prior commentary posed the following question:

In face of negligible lease rates and low spreads, the increase of 1800 tonnes in gold forwards and swaps in the first half of 2009 is hard to explain in terms of traditional gold lending, prompting another query: has the whole category of gold forwards and swaps as reported by the BIS now been severely infected by instruments that have no credible counterparty in the physical market?

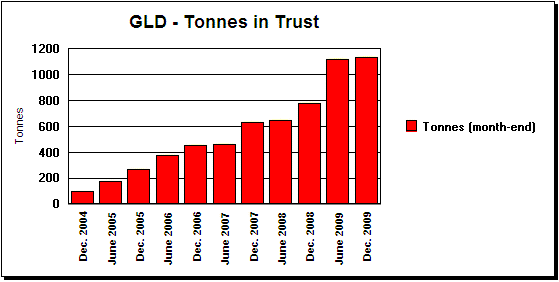
However, taking both halves of 2009 into consideration, parallel movements in OTC gold forwards and swaps and tonnes held in trust by SPDR Gold Shares (GLD) suggest another at least partial explanation: GLD has acquired much of its gold not by market purchases but through forwards and swaps intermediated by the bullion banks from official reserves.

Coincidence or Design? The following chart shows tonnes held in trust as reported by GLD. During the first half of 2009, its holdings jumped by 340 tonnes, by far the largest half year's increase in its history. Another 33 tonnes were added in the second half. Coincidence, or is there a reason why GLD's holdings in 2009 mirrored the big first half jump and last half hold steady pattern of OTC gold forwards and swaps?

Almost from its inception, questions have been raised regarding whether GLD has the all gold it claims to have. In part the natural consequence of its less than convincing custodial and auditing procedures, these doubts take added weight given well-documented tightness in the physical market. Still, here at The Golden Sextant, we have inclined to the view that the larger risk with GLD is not whether it has the gold it claims, but whether its gold -- mostly situated in the United Kingdom -- is insufficiently protected against the threat of government seizure. See RKL, Musings on the Realms of GLD (10/15/2007).

Speaking at the October 2006 dinner of the Committee for Monetary Research and Education (audio available at www.cmre.org), Pierre Lassonde, former president of Newmont Mining and past chairman of the World Gold Council, made a couple of interesting disclosures about GLD's gold. First, most of it was then stored in HSBC's London vault, but HSBC was in the process of constructing a new vault just outside London expressly to accommodate GLD's expected growth. Second, he had actually visited the vault and seen the gold.

A recent and quite comprehensive study of GLD's governing documents suggests that although GLD may not lend or swap the gold it holds in trust, nothing prevents it from acquiring gold that has been leased, loaned, deposited or swapped to bullion banks by central banks. C.A. Fitts et al., GLD and SLV: Disclosure in the Precious Metals Puzzle Palace (May 3, 2010) ("Leased Bullion: ETF underlying documents may permit "Authorized Participants" [footnote omitted] to contribute (or at least do not expressly prohibit them from contributing) to the ETFs gold and silver leased from central banks instead of precious metals to which the Authorized Participants hold absolute legal title.")

In reporting their gold reserves, central banks commonly include gold out on loan, deposit or swap notwithstanding that much of this gold has in fact been sold into the market. See, e.g., N.R. Ryan, Gold Market Lending (Blanchard & Co., Dec. 1, 2006), and materials cited. See also H. Takeda, Treatment of Allocated/Unallocated Gold Held as Reserve Assets and Gold Swaps and Gold Deposits, Follow-Up Paper (RESTEG) # 11.1, International Monetary Fund (August 2006).

Indeed, as Frank Veneroso used to put it, the borrowing and sale of official gold by bullion bank intermediaries to support the gold carry trade not only put downward pressure on gold prices, but also created a corner on the market for the principal buyers, most notably the women of India. To repay the carry trade gold to the central banks, the bullion banks first had to repurchase in the market, presumably at prices sufficiently attractive to draw high carat jewelry from the subcontinent. The scenario may be a bit overdrawn, but the point is clear.

The Achilles' heel of gold lending to the carry trade, as opposed to gold loans to support forward sales by gold mining companies, was the requirement to repurchase in the market, possibly at much higher prices, to make repayment. As noted in many prior commentaries, forward sales by gold mining companies, which have dropped sharply in recent years, never accounted for more than small portion of OTC gold forwards and swaps. The carry trade was always the bulk of this business, and thus the central banks' primary tool for putting downward pressure on gold prices.

From this perspective, the design of GLD is a distinct improvement upon the carry trade as a vehicle for blunting upward pressure on gold prices from rising investment demand. Gold moves in and out of GLD in "baskets" of 10,000 ounces created by "authorized participants." The list of authorized participants includes all the major bullion banks, who as noted appear free to create baskets with gold loaned or swapped to them by central banks and then to transfer those baskets to GLD in return for shares to be sold to investors.

In that event, unlike the gold carry trade, official gold is not fully surrendered to the international market by the intermediary bullion banks and subsequently transported to God only knows where. Rather, with GLD as the (presumably bona fide) purchaser from the intermediary bank, the gold moves to an identified vault subject to the jurisdiction and laws of the United Kingdom. The central banks, as before, can continue to count it in their gold reserves, but now with more practical justification since it also remains within the banking system and their effective control.

Ass Backwardation. In recent months, while GLD has generally sold at a slight discount to net asset value, other bullion funds with more transparent and credible custodial and auditing procedures have commanded significant premiums. E.g., Central Fund of Canada (CEF), Central Gold Trust (GTU), Sprott Physical Gold Trust (PHYS). Anecdotal evidence also continues to surface of premiums for spot delivery of physical metal or cash settlement in lieu of physical.

Gold forward rates as reported by the London Bullion Market Association (www.lbma.org.uk) have remained positive territory, but accompanied by sporadic negative lease rates at the shorter maturities. See Gold Derivatives: The Tide Turns (5/25/2009), and materials cited. At the LBMA, therefore, gold continues to avoid backwardation, but only because central banks continue to lend at historically very low lease rates.

It is a strange situation. Gold for spot delivery and bullion funds with high credibility for physical possession of metal in the amounts claimed are selling at premiums over paper of lesser reliability. But where gold is arbitraged against currencies on the basis of relative interest rates, it remains in contango. Freer private markets are increasingly disconnecting from more regulated and controlled official markets. Backwardation is arriving in gold, but ass backwards. Of course, nobody should be surprised. That is the way central banks typically operate.

The "Restless" Metal. Concluding his classic study of silver, Silver: The Restless Metal (Wiley, 1981), Professor Roy Jastram, better known for his The Golden Constant (Wiley, 1977), warned (at p. 157):

The surge and collapse of 1980 is but the most recent and violent of this volatile metal. It has been erratic since 1875. Anyone who enters the silver market, on whatever terms, is surely put on guard by history's lessons.

The restless metal may again be preparing to deliver some surprises at least if the data on OTC derivatives for other precious metals, principally silver, is any guide. The large increases in both forwards and swaps and options posted during the first half of 2009 period were almost completely reversed during the second, as illustrated by the two charts below.

Forwards and swaps, which had risen from $62 to $101 billion in the first half of 2009, fell to $76 billion. Expressed in ounces of silver at end-of-period prices, forwards and swaps on other precious metals fell from 7.25 to 4.47 billion ounces, or from over 10.5 years of new mine production of silver at the 2008 rate (680 million ounces) to still more than 6.5 years.

Options, which had more than doubled in the first half from $49 to $102 billion, collapsed to $31 billion at year-end.

Perhaps the Commodity Futures Trading Commission will find an explanation for these extraordinary gyrations in OTC silver derivatives, but the odds that they resulted from benign market forces appear remote. See B. Murphy, A London trader walks the CFTC through a silver manipulation in advance, Statement to the CFTC (March 25, 2010); M. Gray, Metal$ are in the pits M. Gray, New York Post (April 11, 2010); M. Gray, Feds probing JPMorgan trades in silver pit, New York Post (May 9, 2010); and J. Weil, Rigged-Market Theory Scores a Perfect Quarter, Bloomberg.com (May 13, 2010).

Position Limits versus Cover Requirements. The CFTC's March 25, 2010, hearing focused on the advisability of imposing speculative position limits on futures and options trading in the precious and base metals markets. Whatever their utility in the base metals or other commodity markets, position limits with respect to the monetary metals, especially gold, are a bit of a red herring. The real issue is the ability of shorts to deliver physical metal upon demand.

During the gold standard era, banks developed through experience a prudential rule calling for 40% physical gold cover for demand and other short-term deposits. A similar rule would seem to make sense in a regulated gold futures market, where shorts effectively take the role of the bank and longs the role of depositor with the right to demand physical delivery. Because the situations are not identical, an argument might be made that the cover requirement applicable under normal circumstances should be less than 40%.

But just as there is a standard or normal margin requirement, there could be a corresponding cover requirement. Like the margin percentage, the cover percentage could be flexible, moving with the margin requirement. When higher margin were required from the longs, so too would higher cover from the shorts. Longs who can afford to post higher margin are potentially more capable of demanding (and paying for) delivery. Such a rule would tend toward market stability. Downward pressure on prices caused by longs exiting the market in response to higher margin requirements would be offset by remaining shorts having to increase their physical cover.

Addendum. For those interested, updates of the other charts on OTC derivatives contained in prior commentaries are reproduced below. Total OTC derivatives increased marginally from $605 to to $615 trillion. However, derivatives on other commodities (excluding precious metals) continued their steep decline, dropping from $3.1 to $2.4 trillion.